Note
Go to the end to download the full example code.
Line Widget#
The line widget can be enabled and disabled by the
pyvista.Plotter.add_line_widget() and
pyvista.Plotter.clear_line_widgets() methods respectively.
Unfortunately, PyVista does not have any helper methods to utilize this
widget, so it is necessary to pass a custom callback method.
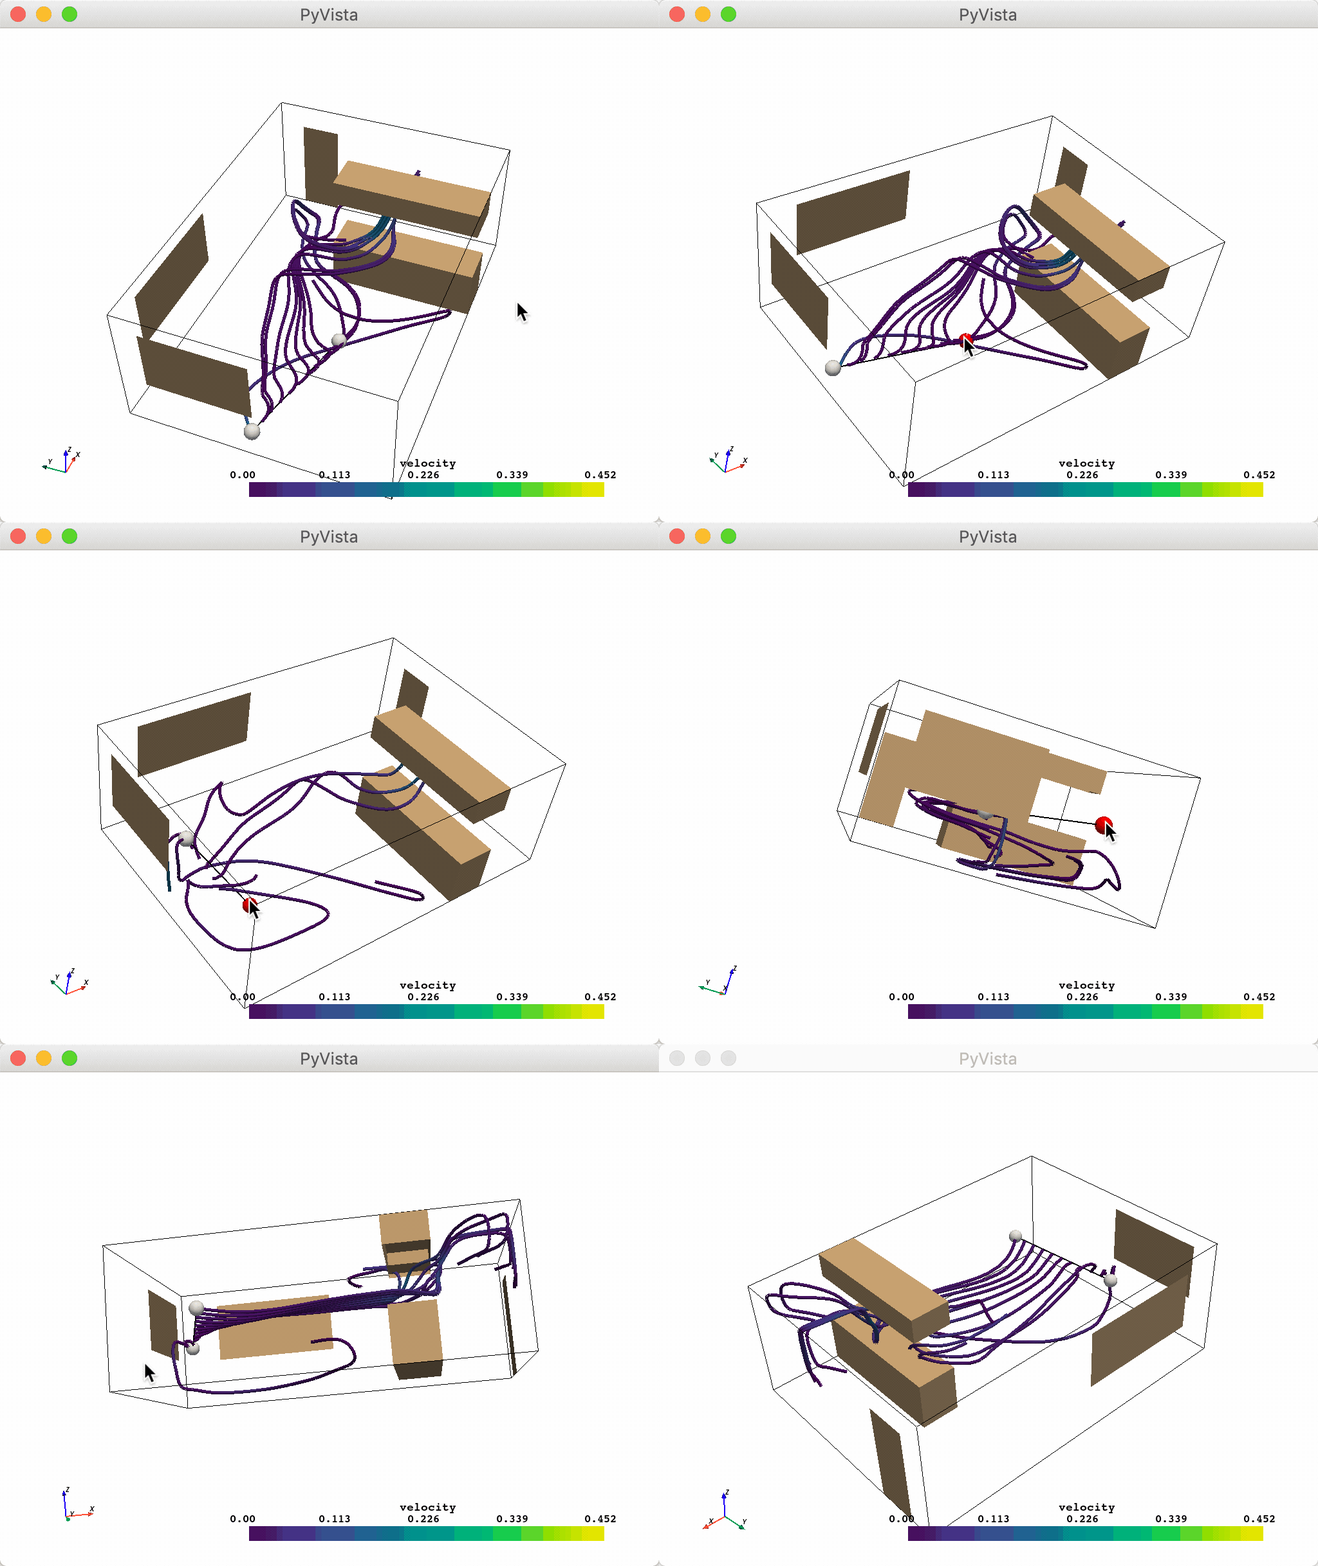
One particularly fun example is to use the line widget to create a source for
the pyvista.DataSetFilters.streamlines() filter. Again note the use of
the name argument in add_mesh.
import numpy as np

import pyvista as pv
from pyvista import examples

pv.set_plot_theme('document')

mesh = examples.download_kitchen()
furniture = examples.download_kitchen(split=True)

arr = np.linalg.norm(mesh['velocity'], axis=1)
clim = [arr.min(), arr.max()]
p = pv.Plotter()
p.add_mesh(furniture, name='furniture', color=True)
p.add_mesh(mesh.outline(), color='black')
p.add_axes()


def simulate(pointa, pointb):
    streamlines = mesh.streamlines(
        n_points=10,
        max_steps=100,
        pointa=pointa,
        pointb=pointb,
        integration_direction='forward',
    )
    p.add_mesh(streamlines, name='streamlines', line_width=5, render_lines_as_tubes=True, clim=clim)


p.add_line_widget(callback=simulate, use_vertices=True)
p.show()

And here is a screen capture of a user interacting with this

Total running time of the script: (0 minutes 0.555 seconds)
