3D visualization and mesh analysis for science and engineering

PyVista is an open source, community-owned project, MIT licensed and NumFOCUS Affiliated.
CoDimensional PBC, founded by PyVista maintainers, is the project's commercial steward.
Overview#
PyVista is the foundational Python library for 3D visualization and mesh analysis in scientific computing and engineering. PyVista plays the same role for 3D data that pandas plays for tabular data and xarray plays for labeled n-dimensional arrays.
a NumPy-native API for 3D visualization and mesh analysis
dataset structures and filters for points, surfaces, and volumes
one plotting framework for notebooks, scripts, CI, and apps
streamlined 3D for newcomers and graphics experts alike
Use PyVista for figures in papers and presentations, interactive analysis in notebooks, and as the visualization layer of larger Python tools.
Built for production#
3D code has to keep working when the underlying graphics stack changes. PyVista is image-regression tested on every commit across the supported matrix of Python and VTK releases. Public APIs follow a deliberate deprecation lifecycle (warn, then error, then remove) across at least three minor versions, and every release ships wheels for every supported Python version.
The C++ toolkit underneath does not provide the same guarantees. Its Python bindings shift between releases, large parts of the surface ship without test coverage, and rendering changes are not gated on visual diffs. PyVista is what science and engineering teams reach for when code written today has to still produce the same picture two years from now.
Built to extend#
Downstream libraries build on PyVista through a small, lazily evaluated extension API. Third-party packages attach domain-specific filters and plotter components via registered accessors, with no subclassing, no monkey-patching, and no vendoring of upstream algorithms. This is the same contract pandas exposes for tabular accessors and xarray exposes for labeled arrays. See Extending PyVista for the full contract.
For a curated, continuously updated list of domain-specific tooling that interoperates with or is built on PyVista, see awesome-pyvista.
Reach for the underlying VTK toolkit directly only when there is genuinely no PyVista equivalent. When that happens, please file an issue. There should be one.
Want to test-drive PyVista? Check out our live examples on MyBinder: ![]()
Brief Examples#
Here are some brief interactive examples that demonstrate how you might want to use PyVista:
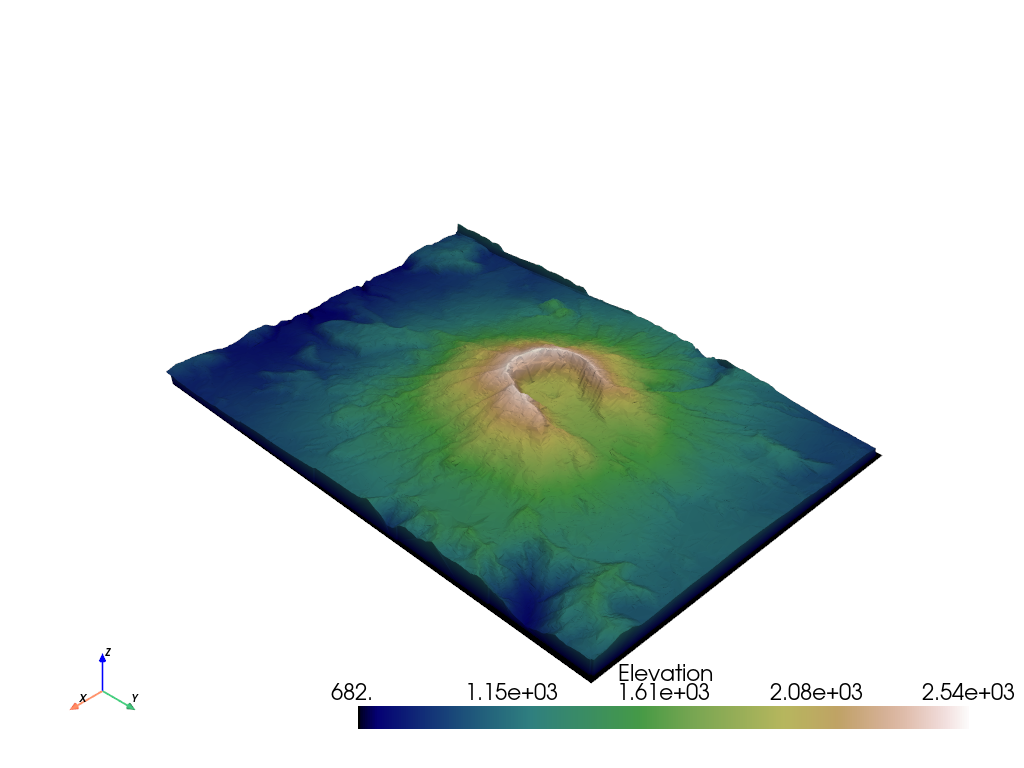
Maps and Geoscience#
Download the surface elevation map of Mount St. Helens and plot it.
from pyvista import examples
mesh = examples.download_st_helens()
warped = mesh.warp_by_scalar('Elevation')
surf = warped.extract_surface().triangulate()
surf = surf.decimate_pro(0.75)  # reduce the density of the mesh by 75%
surf.plot(cmap='gist_earth')
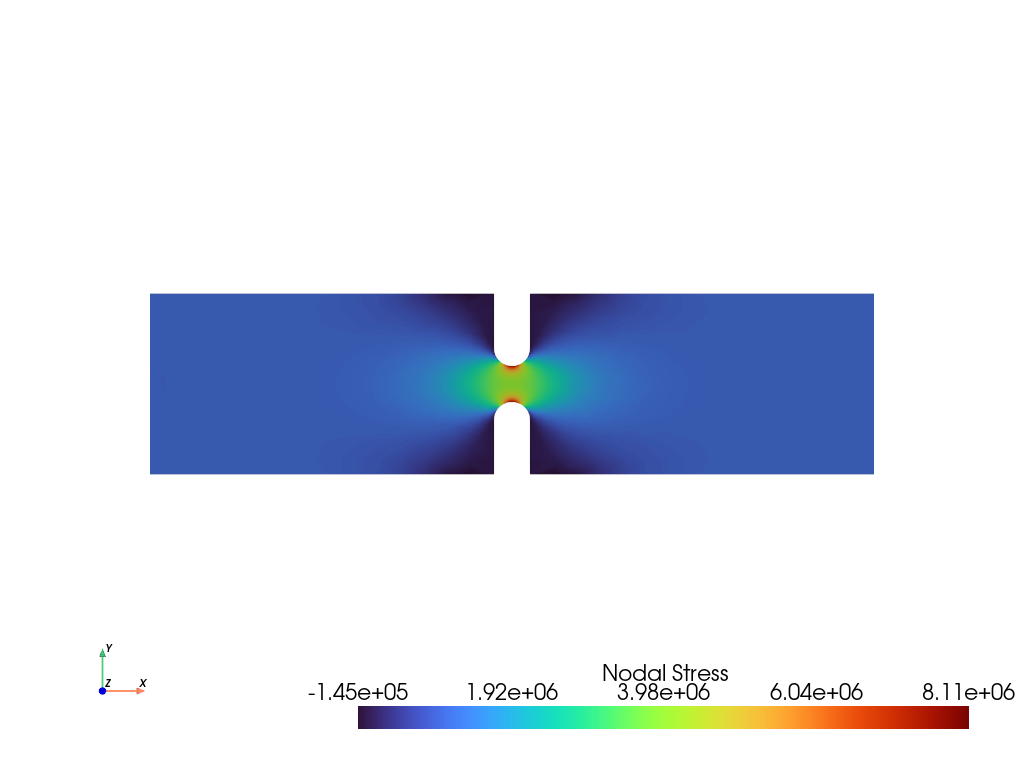
Finite Element Analysis#
Plot the ‘X’ component of elastic stress of a 3D notch specimen.
from pyvista import examples
mesh = examples.download_notch_stress()
mesh.plot(scalars='Nodal Stress', component=0, cmap='turbo', cpos='xy')
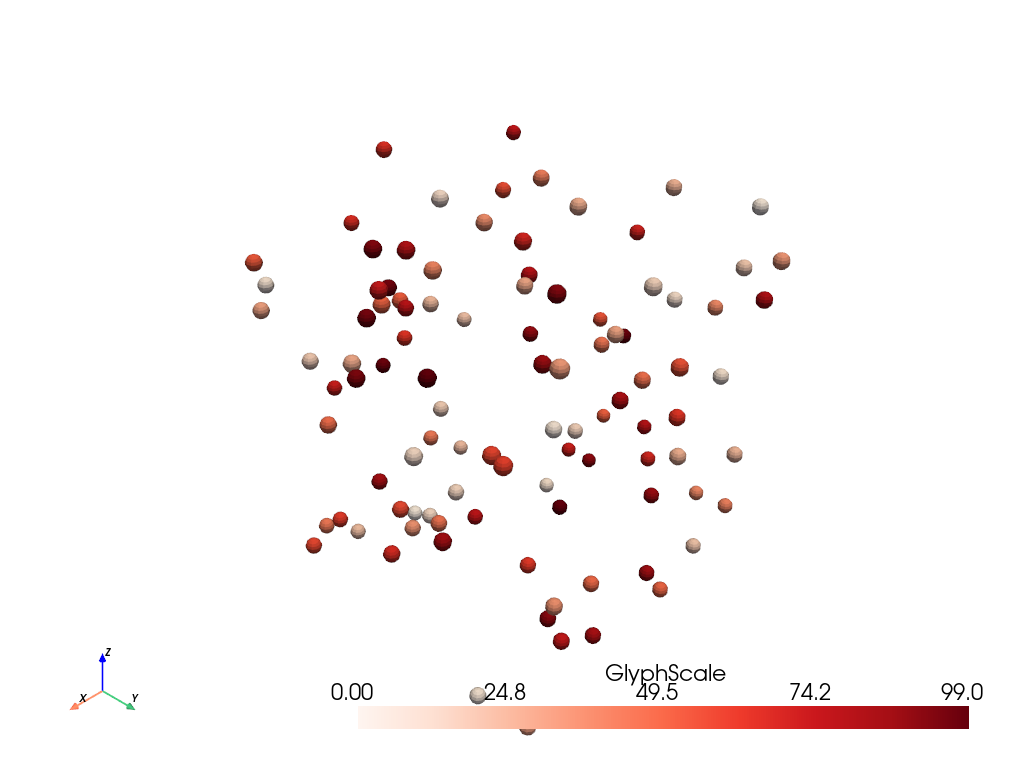
Simple Point Cloud with NumPy#
Easily integrate with NumPy and create a variety of geometries and plot them. You could use any geometry to create your glyphs, or even plot the points directly.
import numpy as np
import pyvista as pv

rng = np.random.default_rng(seed=0)
point_cloud = rng.random((100, 3))
pdata = pv.PolyData(point_cloud)
pdata['orig_sphere'] = np.arange(100)

# create many spheres from the point cloud
sphere = pv.Sphere(radius=0.02, phi_resolution=10, theta_resolution=10)
pc = pdata.glyph(scale=False, geom=sphere, orient=False)
pc.plot(cmap='Reds')
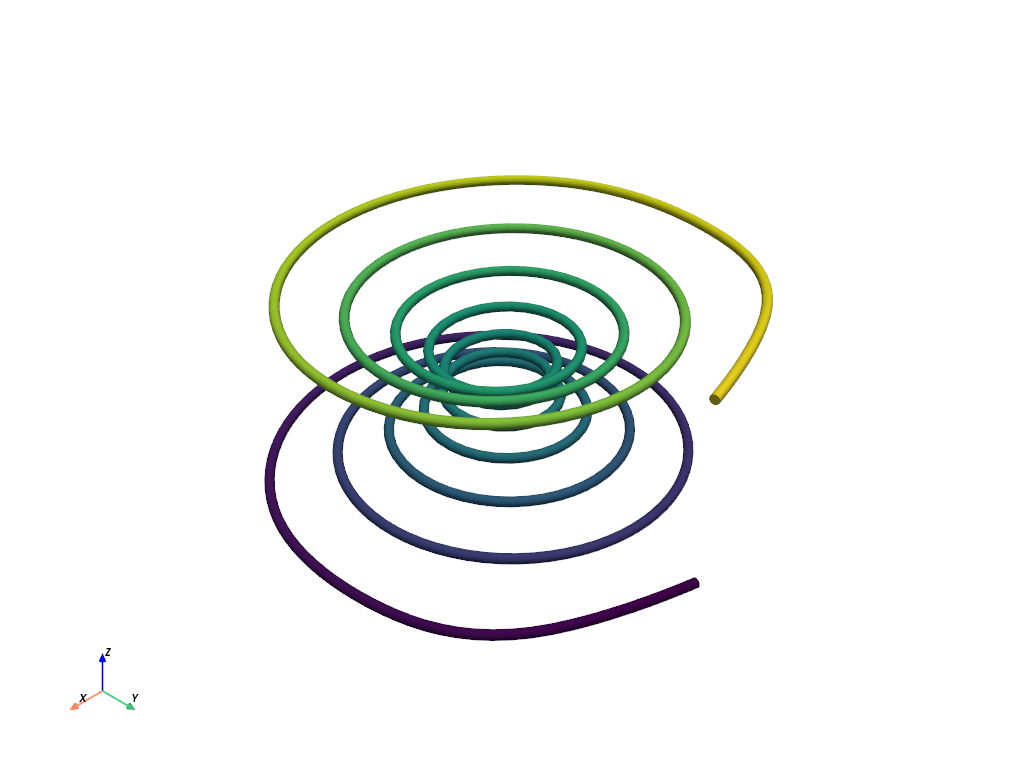
Plot a Spline#
Generate a spline from an array of NumPy points.
import numpy as np
import pyvista as pv

# Make the xyz points
theta = np.linspace(-10 * np.pi, 10 * np.pi, 100)
z = np.linspace(-2, 2, 100)
r = z**2 + 1
x = r * np.sin(theta)
y = r * np.cos(theta)
points = np.column_stack((x, y, z))

spline = pv.Spline(points, 500).tube(radius=0.1)
spline.plot(scalars='arc_length', show_scalar_bar=False)
Boolean Operations on Meshes#
Subtract a sphere from a cube mesh.
import pyvista as pv
import numpy as np

def make_cube():
    x = np.linspace(-0.5, 0.5, 25)
    grid = pv.StructuredGrid(*np.meshgrid(x, x, x))
    surf = grid.extract_surface().triangulate().flip_faces()
    return surf

# Create example PolyData meshes for boolean operations
sphere = pv.Sphere(radius=0.65, center=(0, 0, 0))
cube = make_cube()

# Perform a boolean difference
boolean = cube.boolean_difference(sphere)
boolean.plot(color='darkgrey', smooth_shading=True, split_sharp_edges=True)

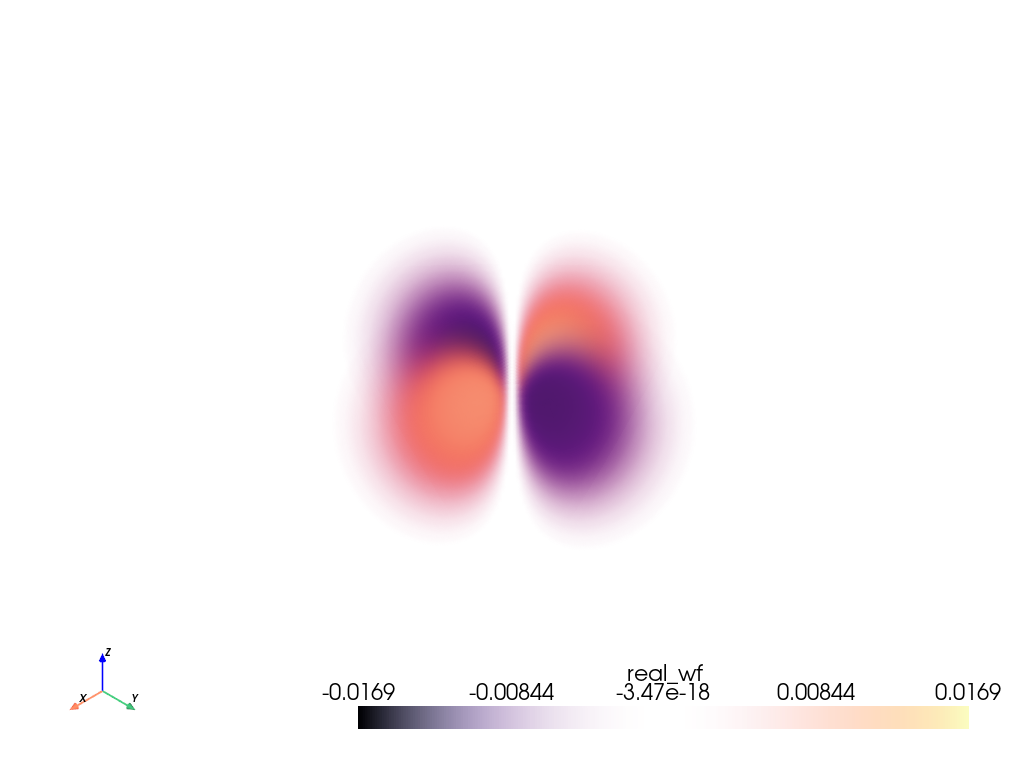
Plot Volumetric Data#
Plot the \(3d_{xy}\) orbital of a hydrogen atom.
Note
This example requires sympy.
from pyvista import examples
grid = examples.load_hydrogen_orbital(3, 2, -2)
grid.plot(volume=True, opacity=[1, 0, 1], cmap='magma')
Translating#
The recommended way for new contributors to translate PyVista’s documentation is to join the translation team on Transifex.
There is a pyvista translation page for pyvista (main) documentation.
Login to transifex service.
Go to pyvista translation page.
Click
Request languageand fill form.Wait acceptance by transifex pyvista translation maintainers.
(After acceptance) Translate on transifex.
Translations are stored in pyvista-doc-translations, which also owns the dedicated pipeline that builds and publishes the localized documentation.
Details can be found here: https://help.transifex.com/en/
Status#
Deployment |
|
|
Build Status |
|
|
Metrics |
|
|
Activity |
|
|
GitHub |
|
|
Citation |
|
|
License |
|
|
Community |
|


Professional Support#
PyVista is a community-owned Open Source project, but many users and organizations rely on it in production workflows, research pipelines, and custom visualization systems. If you need expert guidance, development help, or guaranteed support, there are several ways to engage with the people who build and maintain PyVista.
For general inquiries, reach out to info@pyvista.org and we can help connect you with the right community experts for your 3D visualization or analysis needs.
If you are looking for professional services (consulting, custom development, feature design, integration support, or training), consider sponsoring PyVista’s core developers through the “Sponsor this project” section on GitHub. Sponsorship not only provides direct access to experts but also helps sustain critical maintenance and ongoing feature work that keeps PyVista reliable and modern.
More details can be found in the discussion post: pyvista/pyvista#4033
Sponsoring a developer supports both your project and the health of the PyVista ecosystem, ensuring continued improvements, long-term stability, and expert help when you need it.
