Note
Go to the end to download the full example code.
Extrude Rotation#
Sweep polygonal data creating “skirt” from free edges and lines, and lines from vertices.
This takes polygonal data as input and generates polygonal data on output. The input dataset is swept around the z-axis to create new polygonal primitives. These primitives form a “skirt” or swept surface. For example, sweeping a line results in a cylindrical shell, and sweeping a circle creates a torus.
from __future__ import annotations

import numpy as np

import pyvista

# create a line and rotate it about the Z-axis
resolution = 10
line = pyvista.Line(pointa=(0, 0, 0), pointb=(1, 0, 0), resolution=2)
poly = line.extrude_rotate(resolution=resolution)
poly
/home/runner/work/pyvista/pyvista/pyvista/core/filters/poly_data.py:3144: PyVistaFutureWarning: The default value of the ``capping`` keyword argument will change in a future version to ``True`` to match the behavior of VTK. We recommend passing the keyword explicitly to prevent future surprises.
  warnings.warn(
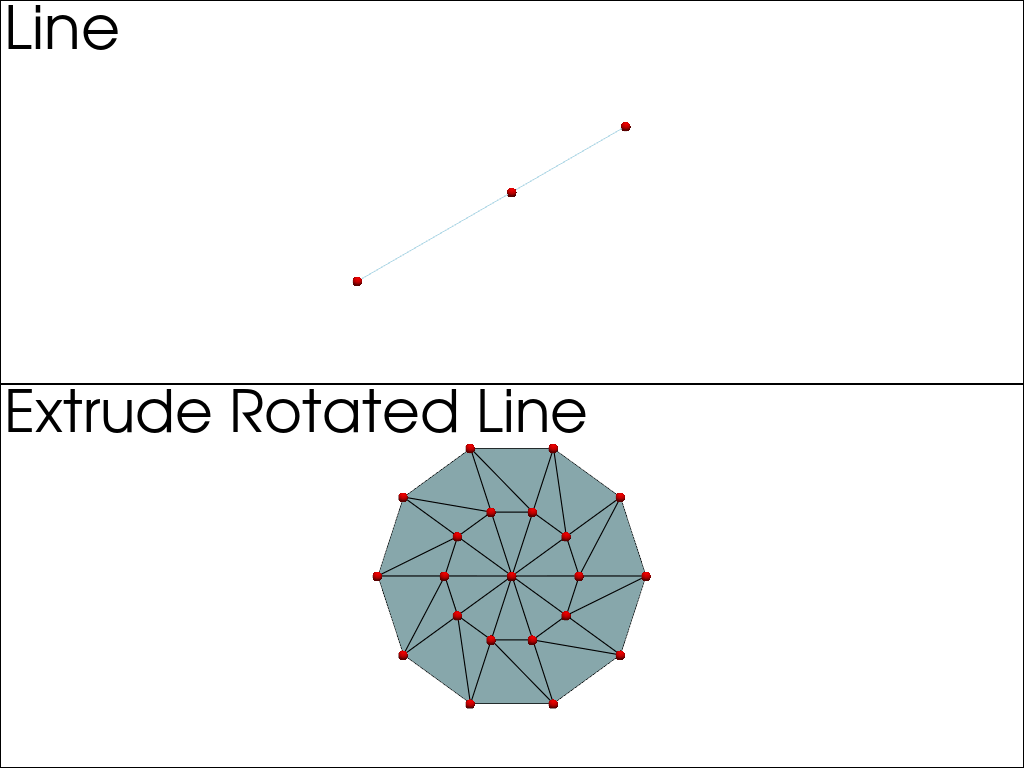
Plot the extruded line#
plotter = pyvista.Plotter(shape=(2, 1))
plotter.subplot(0, 0)
plotter.add_text("Line", font_size=24)
plotter.add_mesh(line, color='lightblue', show_edges=True)
plotter.add_mesh(
    pyvista.PolyData(line.points),
    color="red",
    point_size=10,
    render_points_as_spheres=True,
)
plotter.subplot(1, 0)
plotter.add_text("Extrude Rotated Line", font_size=24)
plotter.add_mesh(poly, color='lightblue', show_edges=True)
plotter.add_mesh(
    pyvista.PolyData(poly.points),
    color="red",
    point_size=10,
    render_points_as_spheres=True,
)

plotter.show(cpos="xy")

Create a spring#
# Create the spring profile (a circle).
plotter = pyvista.Plotter()

vertices = np.array(
    [
        [1.0, 0.0, 0.0],
        [1.0732, 0.0, -0.1768],
        [1.25, 0.0, -0.25],
        [1.4268, 0.0, -0.1768],
        [1.5, 0.0, 0.00],
        [1.4268, 0.0, 0.1768],
        [1.25, 0.0, 0.25],
        [1.0732, 0.0, 0.1768],
    ],
)
faces = np.hstack([[8, 0, 1, 2, 3, 4, 5, 6, 7]])
profile = pyvista.PolyData(vertices, faces)

# Extrude the profile to make a spring.
spring = profile.extrude_rotate(resolution=360, translation=6.0, dradius=1.0, angle=2160.0)
plotter.add_text("Spring", font_size=24)
plotter.add_mesh(spring, color='lightblue', show_edges=True)

plotter.show(cpos="zx")

/home/runner/work/pyvista/pyvista/pyvista/core/filters/poly_data.py:3144: PyVistaFutureWarning: The default value of the ``capping`` keyword argument will change in a future version to ``True`` to match the behavior of VTK. We recommend passing the keyword explicitly to prevent future surprises.
  warnings.warn(
Total running time of the script: (0 minutes 0.545 seconds)
