pyvista.ImageDataFilters.image_dilate_erode#
- ImageDataFilters.image_dilate_erode(
- dilate_value=1.0,
- erode_value=0.0,
- kernel_size=(3, 3, 3),
- scalars=None,
- progress_bar=False,
Dilates one value and erodes another.
image_dilate_erodewill dilate one value and erode another. It uses an elliptical footprint, and only erodes/dilates on the boundary of the two values. The filter is restricted to the X, Y, and Z axes for now. It can degenerate to a 2 or 1-dimensional filter by setting the kernel size to 1 for a specific axis.- Parameters:
- dilate_value
float, default: 1.0 Dilate value in the dataset.
- erode_value
float, default: 0.0 Erode value in the dataset.
- kernel_sizesequence[
int], default: (3, 3, 3) Determines the size of the kernel along the three axes.
- scalars
str,optional Name of scalars to process. Defaults to currently active scalars.
- progress_barbool, default:
False Display a progress bar to indicate progress.
- dilate_value
- Returns:
pyvista.ImageDataDataset that has been dilated/eroded on the boundary of the specified scalars.
Notes
This filter only supports point data. For inputs with cell data, consider re-meshing the cell data as point data with
cells_to_points()or resampling the cell data to point data withcell_data_to_point_data().Examples
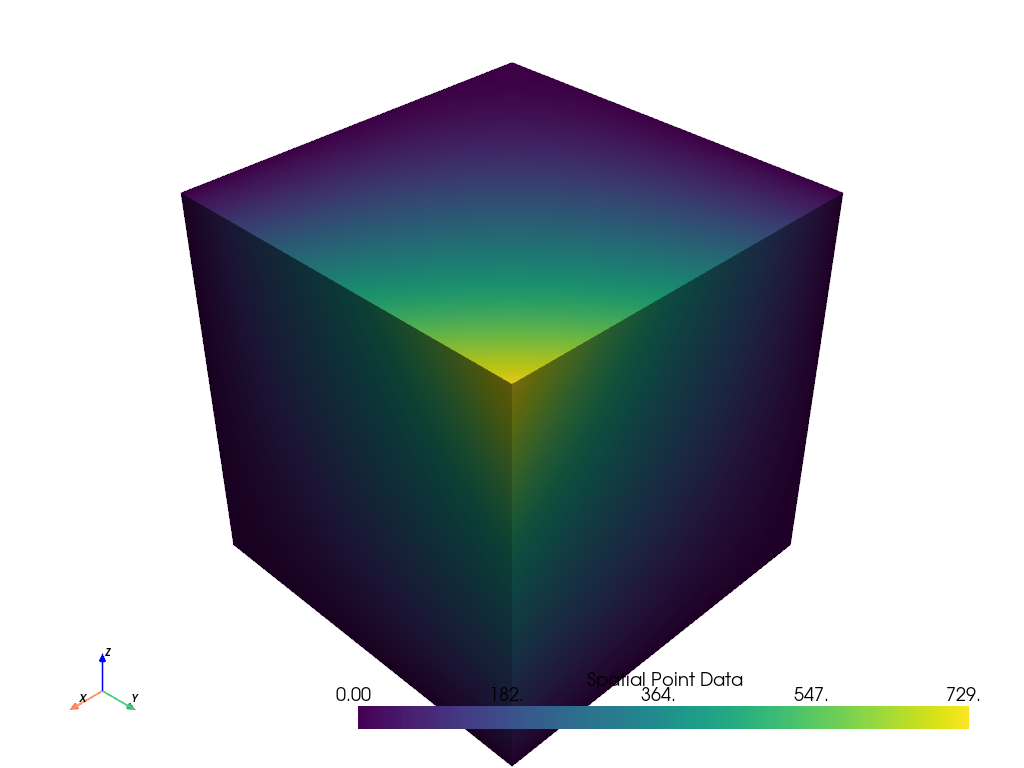
Demonstrate image dilate/erode on an example dataset. First, plot the example dataset with the active scalars.
>>> from pyvista import examples
>>> uni = examples.load_uniform()
>>> uni.plot()
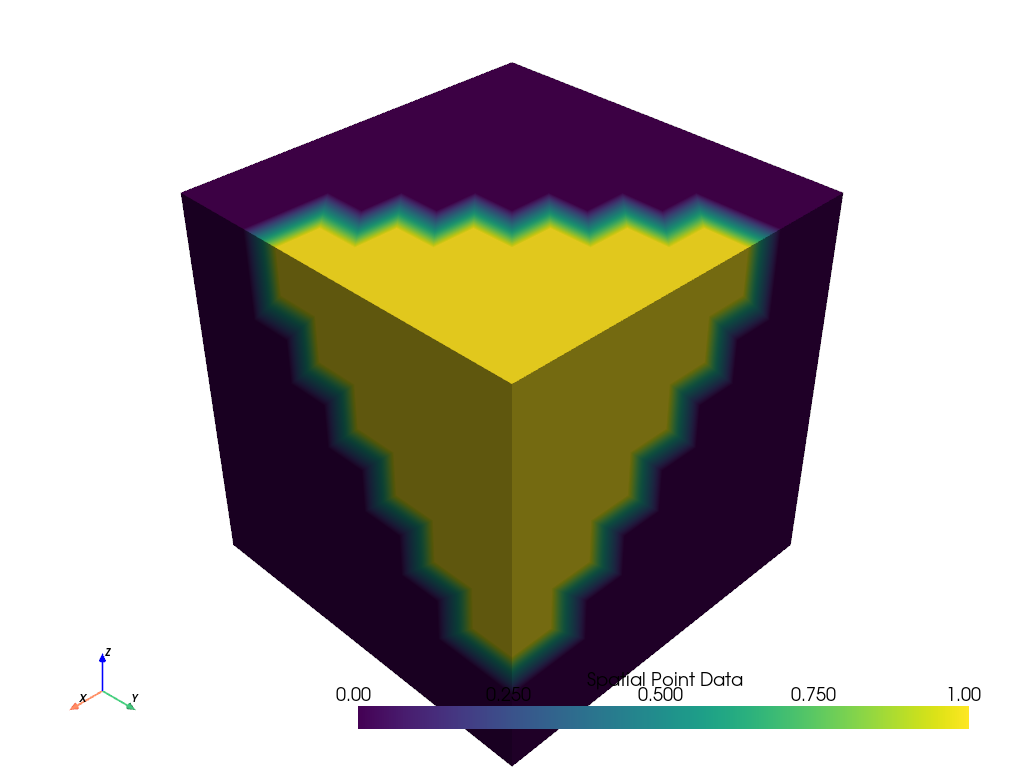
Now, plot the image threshold with
threshold=[400, 600]. Note how values within the threshold are 1 and outside are 0.>>> ithresh = uni.image_threshold([400, 600]) >>> ithresh.plot()
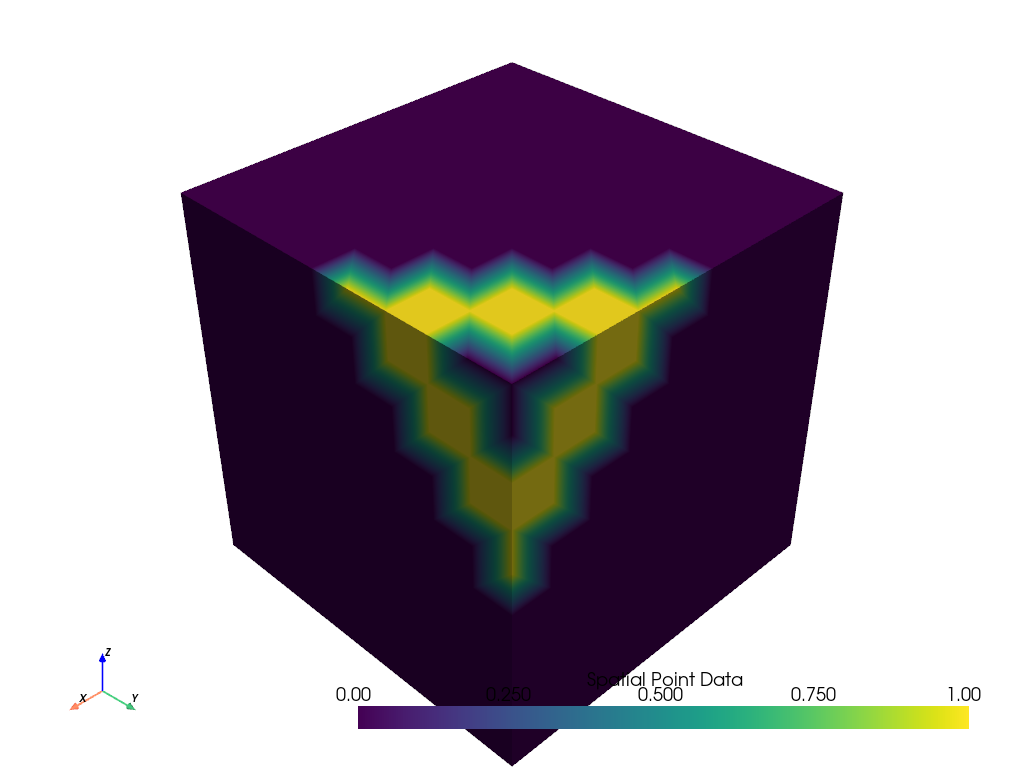
Note how there is a hole in the thresholded image. Apply a dilation/ erosion filter with a large kernel to fill that hole in.
>>> idilate = ithresh.image_dilate_erode(kernel_size=[5, 5, 5])
>>> idilate.plot()