pyvista.ImageDataFilters.pad_image#
- ImageDataFilters.pad_image(
- pad_value: float | VectorLike[float] | Literal['wrap', 'mirror'] = 0.0,
- *,
- pad_size: int | VectorLike[int] = 1,
- pad_singleton_dims: bool = False,
- scalars: str | None = None,
- pad_all_scalars: bool = False,
- progress_bar=False,
Enlarge an image by padding its boundaries with new points.
Added in version 0.44.0.
Padded points may be mirrored, wrapped, or filled with a constant value. By default, all boundaries of the image are padded with a single constant value.
This filter is designed to work with 1D, 2D, or 3D image data and will only pad non-singleton dimensions unless otherwise specified.
- Parameters:
- pad_value
float| sequence[float] | ‘mirror’ | ‘wrap’,default0.0 Padding value(s) given to new points outside the original image extent. Specify:
a number: New points are filled with the specified constant value.
a vector: New points are filled with the specified multi-component vector.
'wrap': New points are filled by wrapping around the padding axis.'mirror': New points are filled by mirroring the padding axis.
- pad_size
int| sequence[int],default1 Number of points to add to the image boundaries. Specify:
A single value to pad all boundaries equally.
Two values, one for each
(X, Y)axis, to apply symmetric padding to each axis independently.Three values, one for each
(X, Y, Z)axis, to apply symmetric padding to each axis independently.Four values, one for each
(-X, +X, -Y, +Y)boundary, to apply padding to each boundary independently.Six values, one for each
(-X, +X, -Y, +Y, -Z, +Z)boundary, to apply padding to each boundary independently.
Note
The pad size for singleton dimensions is set to
0by default, even if non-zero pad sizes are specified for these axes with this parameter. Setpad_singleton_dimstoTrueto override this behavior and enable padding any or all dimensions.- pad_singleton_dimsbool,
defaultFalse Control whether to pad singleton dimensions. By default, only non-singleton dimensions are padded, which means that 1D or 2D inputs will remain 1D or 2D after padding. Set this to
Trueto enable padding any or all dimensions.- scalars
str,optional Name of scalars to pad. Defaults to currently active scalars. Unless
pad_all_scalarsisTrue, only the specifiedscalarsare included in the output.- pad_all_scalarsbool, default:
False Pad all point data scalars and include them in the output. This is useful for padding images with multiple scalars. If
False, only the specifiedscalarsare padded.- progress_barbool, default:
False Display a progress bar to indicate progress.
- pad_value
- Returns:
pyvista.ImageDataPadded image.
Examples
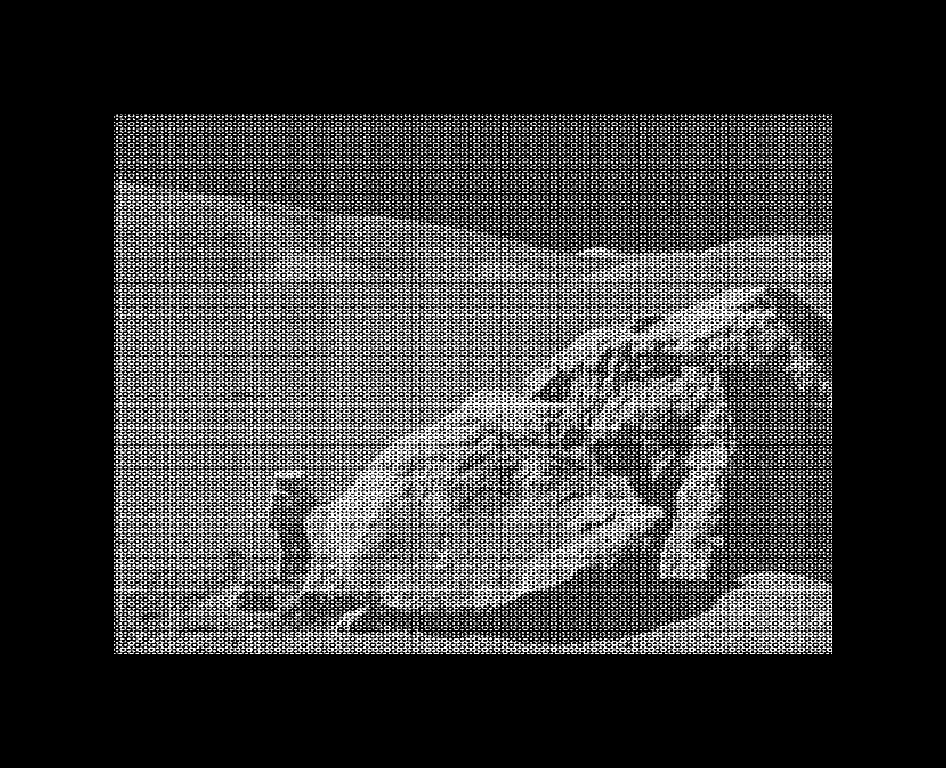
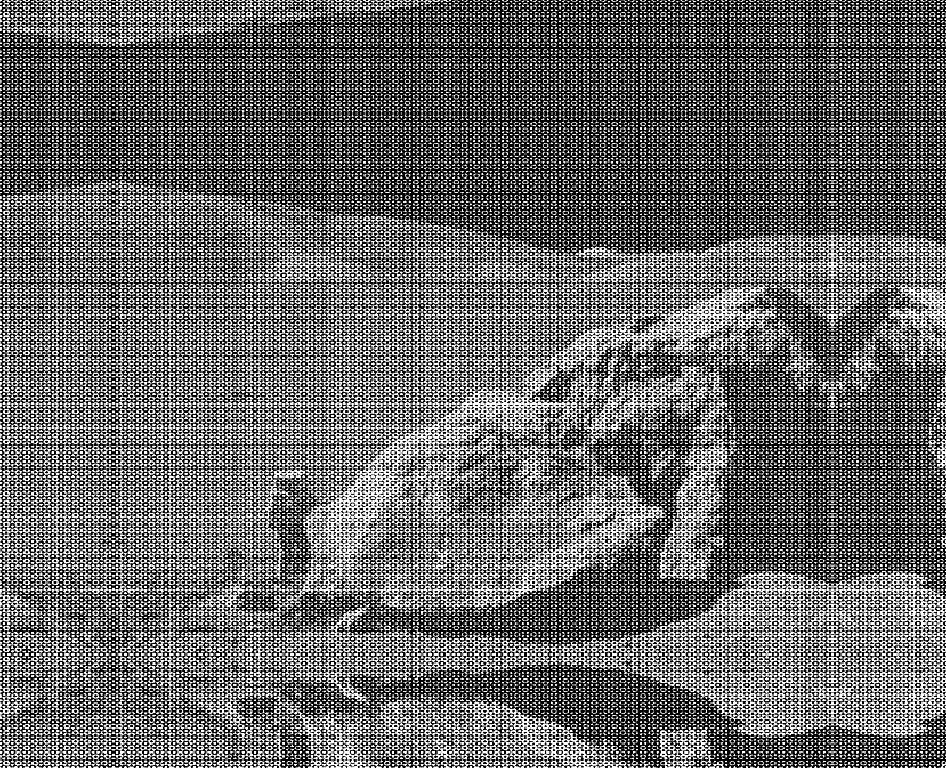
Pad a grayscale image with a 100-pixel wide border. The padding is black (i.e. has a value of
0) by default.>>> import pyvista as pv >>> from pyvista import examples >>> >>> gray_image = examples.download_moonlanding_image() >>> gray_image.dimensions (630, 474, 1) >>> padded = gray_image.pad_image(pad_size=100) >>> padded.dimensions (830, 674, 1)
Plot the image. To show grayscale images correctly, we define a custom plotting method.
>>> def grayscale_image_plotter(image):
...     import vtk
...
...     actor = vtk.vtkImageActor()
...     actor.GetMapper().SetInputData(image)
...     actor.GetProperty().SetInterpolationTypeToNearest()
...     plot = pv.Plotter()
...     plot.add_actor(actor)
...     plot.view_xy()
...     plot.camera.tight()
...     return plot
...
>>>
>>> plot = grayscale_image_plotter(padded)
>>> plot.show()
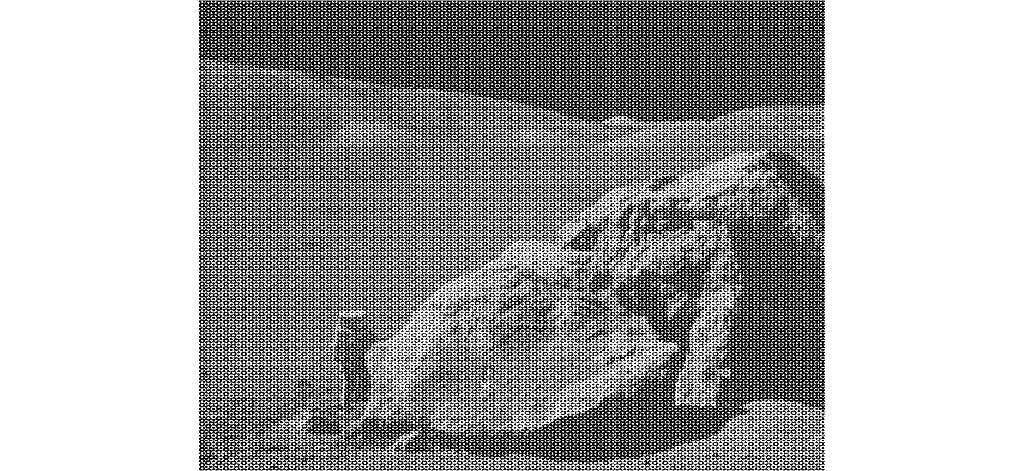
Pad only the x-axis with a white border.
>>> padded = gray_image.pad_image(pad_value=255, pad_size=(200, 0))
>>> plot = grayscale_image_plotter(padded)
>>> plot.show()
Pad with wrapping.
>>> padded = gray_image.pad_image('wrap', pad_size=100)
>>> plot = grayscale_image_plotter(padded)
>>> plot.show()
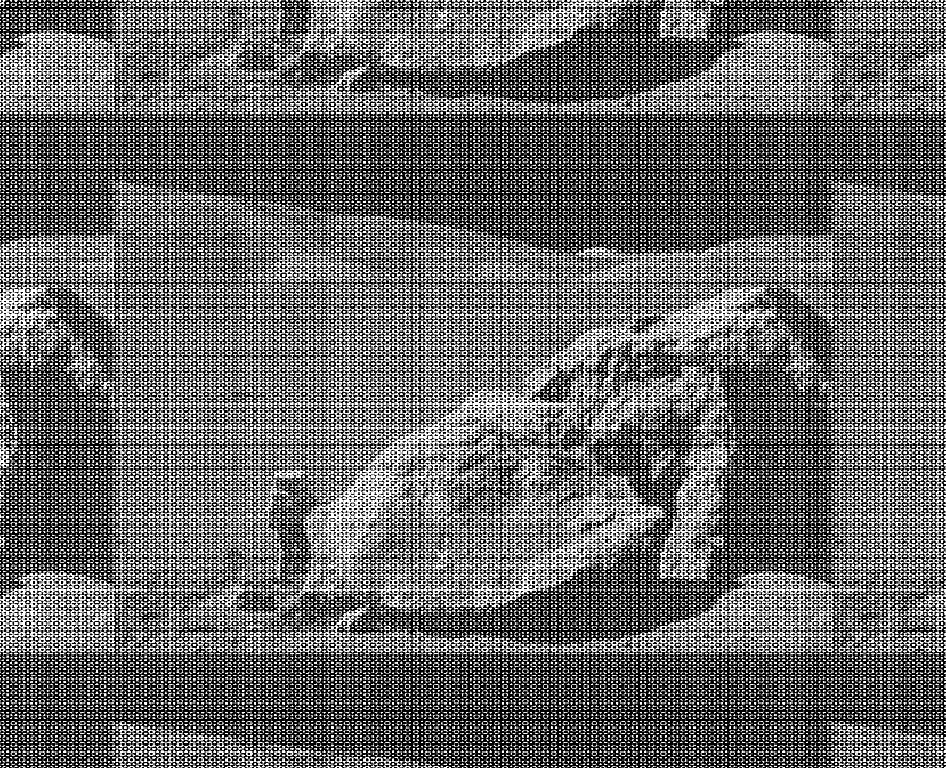
Pad with mirroring.
>>> padded = gray_image.pad_image('mirror', pad_size=100)
>>> plot = grayscale_image_plotter(padded)
>>> plot.show()
Pad a color image using multi-component color vectors. Here, RGBA values are used.
>>> color_image = examples.load_logo()
>>> red = (255, 0, 0, 255)  # RGBA
>>> padded = color_image.pad_image(pad_value=red, pad_size=200)
>>>
>>> plot_kwargs = dict(
...     cpos='xy', zoom='tight', rgb=True, show_axes=False
... )
>>> padded.plot(**plot_kwargs)

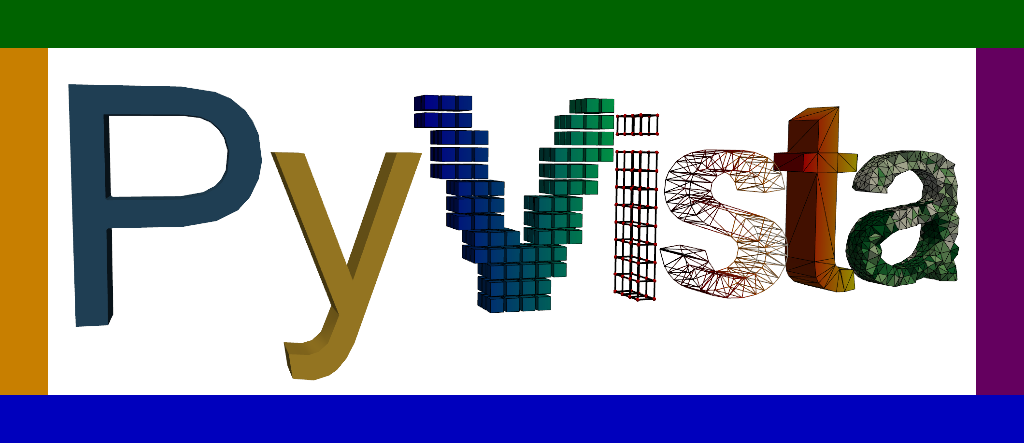
Pad each edge of the image separately with a different color.
>>> orange = pv.Color('orange').int_rgba
>>> purple = pv.Color('purple').int_rgba
>>> blue = pv.Color('blue').int_rgba
>>> green = pv.Color('green').int_rgba
>>>
>>> padded = color_image.pad_image(orange, pad_size=(100, 0, 0, 0))
>>> padded = padded.pad_image(purple, pad_size=(0, 100, 0, 0))
>>> padded = padded.pad_image(blue, pad_size=(0, 0, 100, 0))
>>> padded = padded.pad_image(green, pad_size=(0, 0, 0, 100))
>>>
>>> padded.plot(**plot_kwargs)