DataSet.arrows#
- property DataSet.arrows: pv.PolyData | None[source]#
Return a glyph representation of the active vector data as arrows.
Arrows will be located at the points or cells of the mesh and their size will be dependent on the norm of the vector. Their direction will be the “direction” of the vector.
If there are both active point and cell vectors, preference is given to the point vectors.
- Returns:
pyvista.PolyDataActive vectors represented as arrows.
Examples
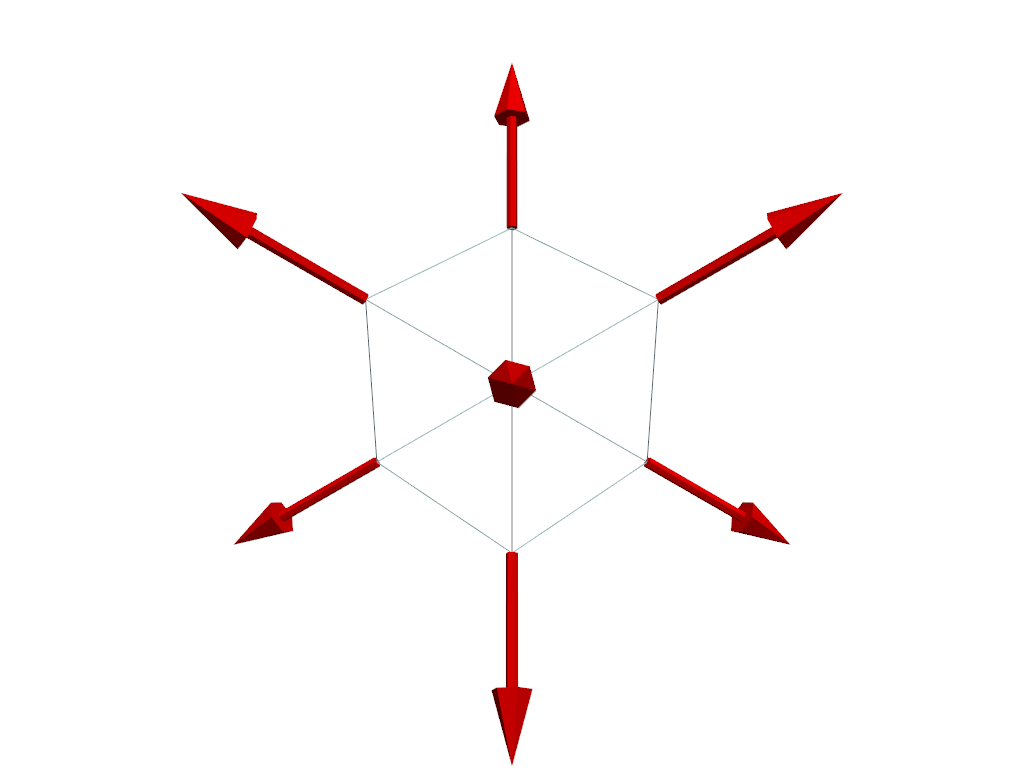
Create a mesh, compute the normals and set them active.
>>> import pyvista as pv
>>> mesh = pv.Cube()
>>> mesh_w_normals = mesh.compute_normals()
>>> mesh_w_normals.active_vectors_name = 'Normals'
Plot the active vectors as arrows. Show the original mesh as wireframe for context.
>>> arrows = mesh_w_normals.arrows
>>> pl = pv.Plotter()
>>> _ = pl.add_mesh(mesh, style='wireframe')
>>> _ = pl.add_mesh(arrows, color='red')
>>> pl.show()