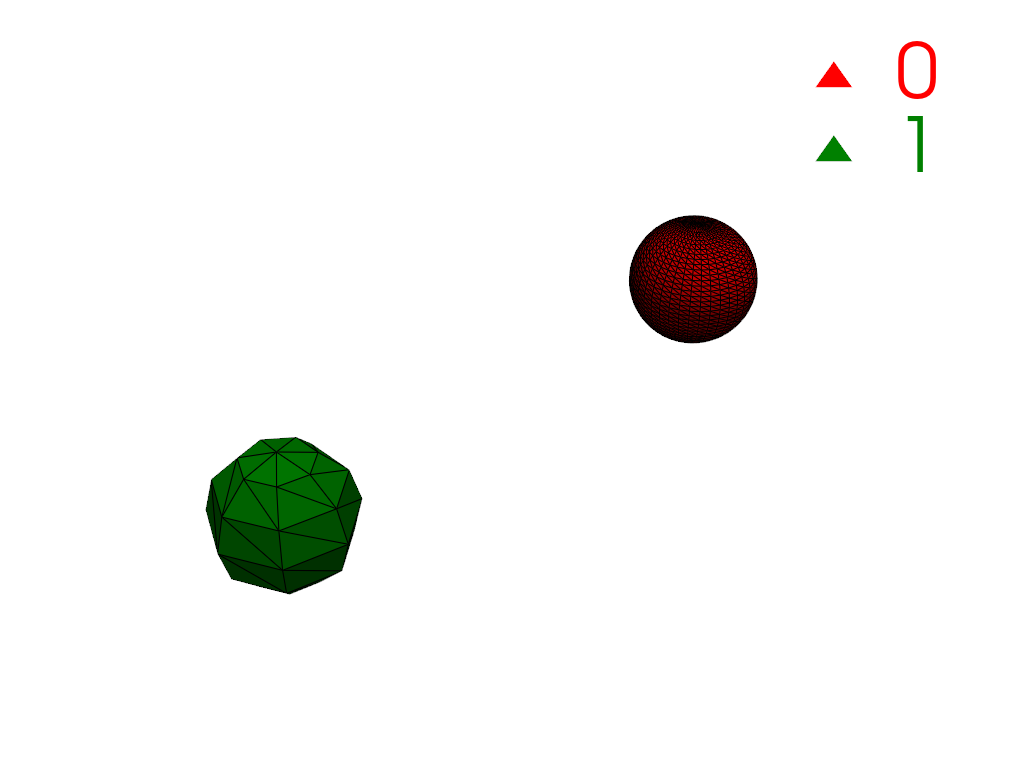
pyvista.DataSetFilters.connectivity#
- DataSetFilters.connectivity(
- extraction_mode: Literal['all', 'largest', 'specified', 'cell_seed', 'point_seed', 'closest'] = 'all',
- variable_input: float | VectorLike[float] | None = None,
- scalar_range: VectorLike[float] | None = None,
- scalars: str | None = None,
- label_regions: bool = True,
- region_assignment_mode: Literal['ascending', 'descending', 'unspecified'] = 'descending',
- region_ids: VectorLike[int] | None = None,
- point_ids: VectorLike[int] | None = None,
- cell_ids: VectorLike[int] | None = None,
- closest_point: VectorLike[float] | None = None,
- inplace: bool = False,
- progress_bar: bool = False,
- **kwargs,
Find and label connected regions.
This filter extracts cell regions based on a specified connectivity criterion. The extraction criterion can be controlled with
extraction_modeto extract the largest region or the closest region to a seed point, for example.In general, cells are considered to be connected if they share a point. However, if a
scalar_rangeis provided, cells must also have at least one point with scalar values in the specified range to be considered connected.See Connectivity and Volumetric Analysis for more examples using this filter.
Added in version 0.43.0:
New extraction modes:
'specified','cell_seed','point_seed', and'closest'.Extracted regions are now sorted in descending order by cell count.
Region connectivity can be controlled using
scalar_range.
Deprecated since version 0.43.0: Parameter
largestis deprecated. Use'largest'orextraction_mode='largest'instead.- Parameters:
- extraction_mode
str, default: “all” 'all': Extract all connected regions.'largest': Extract the largest connected region (by cell count).'specified': Extract specific region IDs. Useregion_idsto specify the region IDs to extract.'cell_seed': Extract all regions sharing the specified cell ids. Usecell_idsto specify the cell ids.'point_seed': Extract all regions sharing the specified point ids. Usepoint_idsto specify the point ids.'closest': Extract the region closest to the specified point. Useclosest_pointto specify the point.
- variable_input
float| sequence[float],optional The convenience parameter used for specifying any required input values for some values of
extraction_mode. Settingvariable_inputis equivalent to setting:'region_ids'if mode is'specified'.'cell_ids'if mode is'cell_seed'.'point_ids'if mode is'point_seed'.'closest_point'if mode is'closest'.
It has no effect if the mode is
'all'or'largest'.- scalar_rangesequence[
float],optional Scalar range in the form
[min, max]. If set, the connectivity is restricted to cells with at least one point with scalar values in the specified range.- scalars
str,optional Name of scalars to use if
scalar_rangeis specified. Defaults to currently active scalars.Note
This filter requires point scalars to determine region connectivity. If cell scalars are provided, they are first converted to point scalars with
cell_data_to_point_data()before applying the filter. The converted point scalars are removed from the output after applying the filter.- label_regionsbool, default:
True If
True,'RegionId'point and cell scalar arrays are stored. Each region is assigned a unique ID. IDs are zero-indexed and are assigned by region cell count in descending order (i.e. the largest region has ID0).- region_assignment_mode
str, default: “descending” Strategy used to assign connected region IDs if
label_regionsis True. Can be either:"ascending": IDs are sorted by increasing order of cell count"descending": IDs are sorted by decreasing order of cell counts"unspecified": no particular order
Added in version 0.47.
ParaView compatibility
The default value
"descending"differs from ParaView’s, which is set to"unspecified"(verified for 5.11 and 6.0 versions).- region_idssequence[
int],optional Region ids to extract. Only used if
extraction_modeisspecified.- point_idssequence[
int],optional Point ids to use as seeds. Only used if
extraction_modeispoint_seed.- cell_idssequence[
int],optional Cell ids to use as seeds. Only used if
extraction_modeiscell_seed.- closest_pointsequence[
int],optional Point coordinates in
(x, y, z). Only used ifextraction_modeisclosest.- inplacebool, default:
False If
Truethe mesh is updated in-place, otherwise a copy is returned. A copy is always returned if the input type is notpyvista.PolyDataorpyvista.UnstructuredGrid.- progress_barbool, default:
False Display a progress bar.
- **kwargs
dict,optional Used for handling deprecated parameters.
- extraction_mode
- Returns:
pyvista.DataSetDataset with labeled connected regions. Return type is
pyvista.PolyDataif input type ispyvista.PolyDataandpyvista.UnstructuredGridotherwise.
See also
Examples
Create a single mesh with three disconnected regions where each region has a different cell count.
>>> import numpy as np
>>> import pyvista as pv
>>> large = pv.Sphere(
...     center=(-4, 0, 0), phi_resolution=40, theta_resolution=40
... )
>>> medium = pv.Sphere(
...     center=(-2, 0, 0), phi_resolution=15, theta_resolution=15
... )
>>> small = pv.Sphere(center=(0, 0, 0), phi_resolution=7, theta_resolution=7)
>>> mesh = large + medium + small
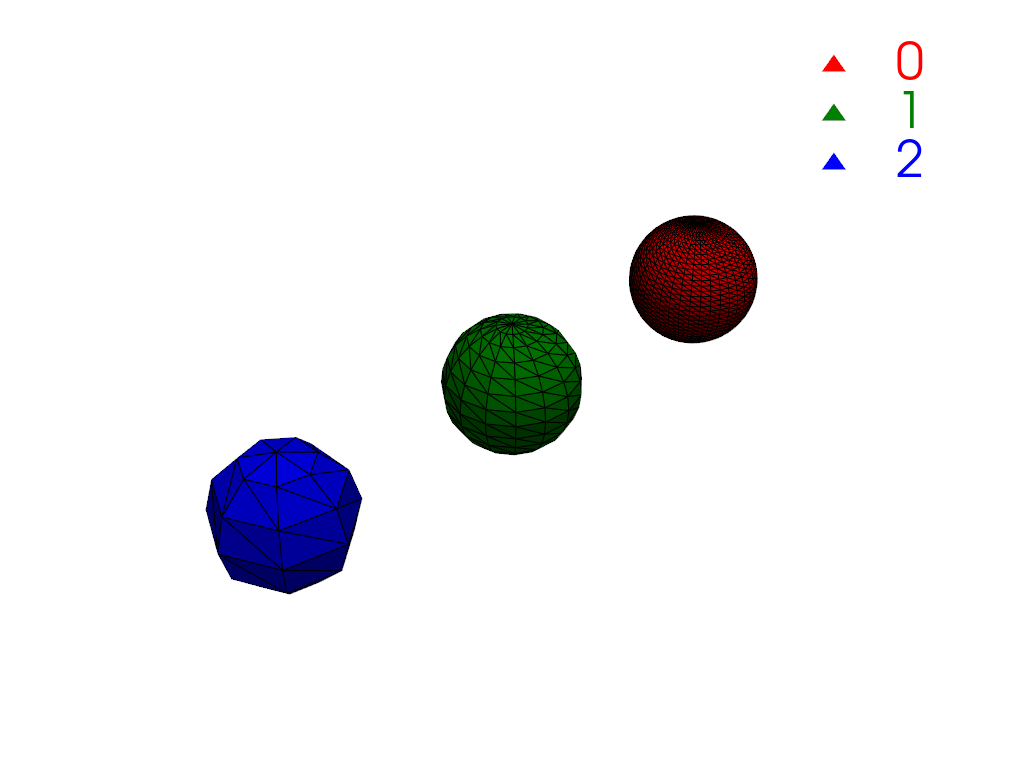
Compute connectivity. There are three regions, one for each sphere.
>>> conn = mesh.connectivity('all')
>>> np.unique(conn['RegionId'])
pyvista_ndarray([0, 1, 2])
Plot the connectivity labels using
color_labels().>>> def labels_plotter(dataset: pv.DataSet) -> pv.Plotter: ... rgb = ['red', 'green', 'blue'] ... colored, color_dict = dataset.color_labels(rgb, return_dict=True) ... pl = pv.Plotter() ... pl.add_mesh(colored, show_edges=True) ... pl.add_legend(color_dict) ... pl.camera_position = pv.CameraPosition( ... position=(3.8, 5.8, 5.8), ... focal_point=(-2.0, 0.0, 0.0), ... viewup=(0.0, 0.0, 1.0), ... ) ... return pl >>> >>> pl = labels_plotter(conn) >>> pl.show()
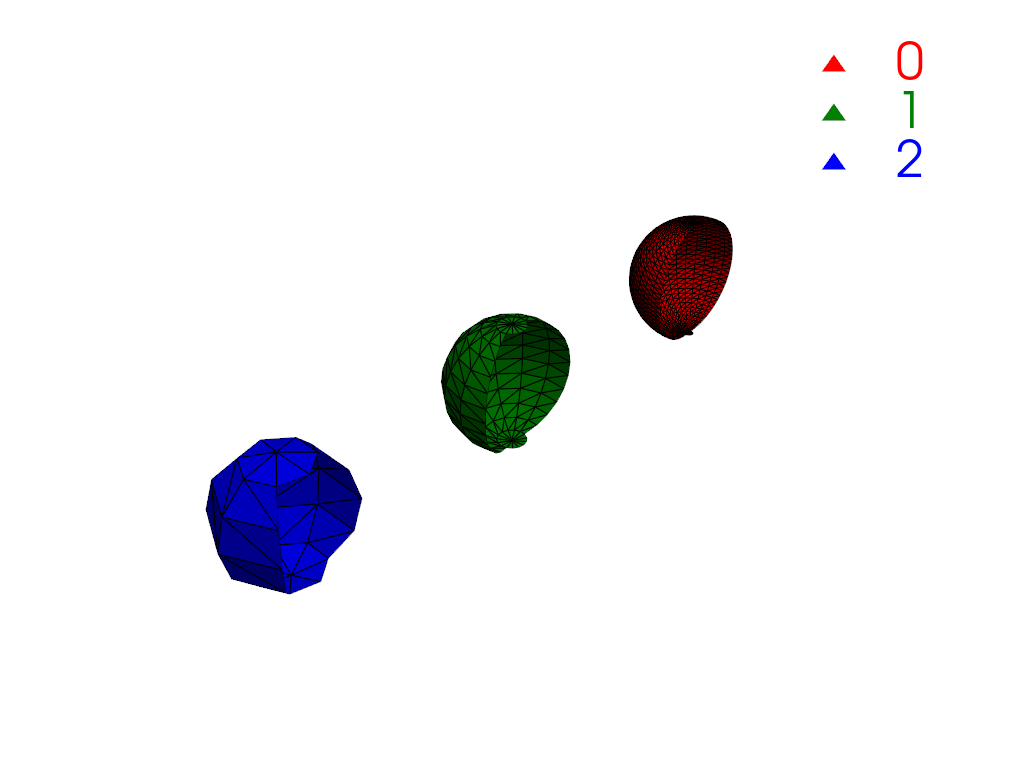
Restrict connectivity to a scalar range.
>>> mesh['y_coordinates'] = mesh.points[:, 1]
>>> conn = mesh.connectivity('all', scalar_range=[-1, 0])
>>> pl = labels_plotter(conn)
>>> pl.show()
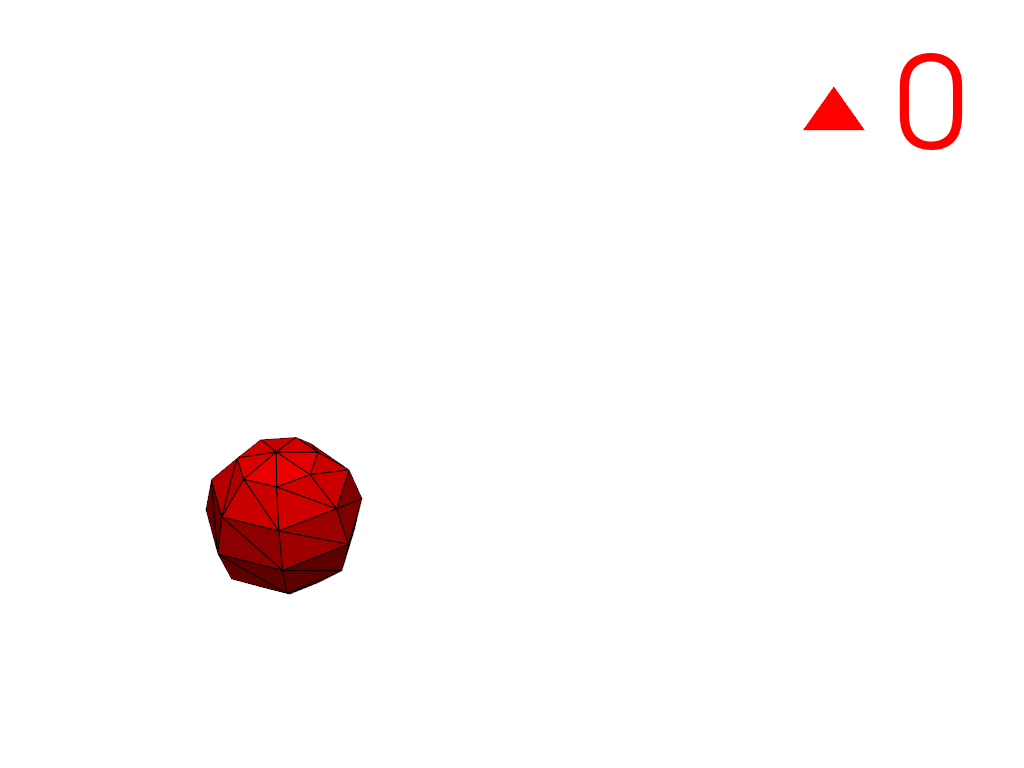
Extract the region closest to the origin.
>>> conn = mesh.connectivity('closest', (0, 0, 0))
>>> pl = labels_plotter(conn)
>>> pl.show()
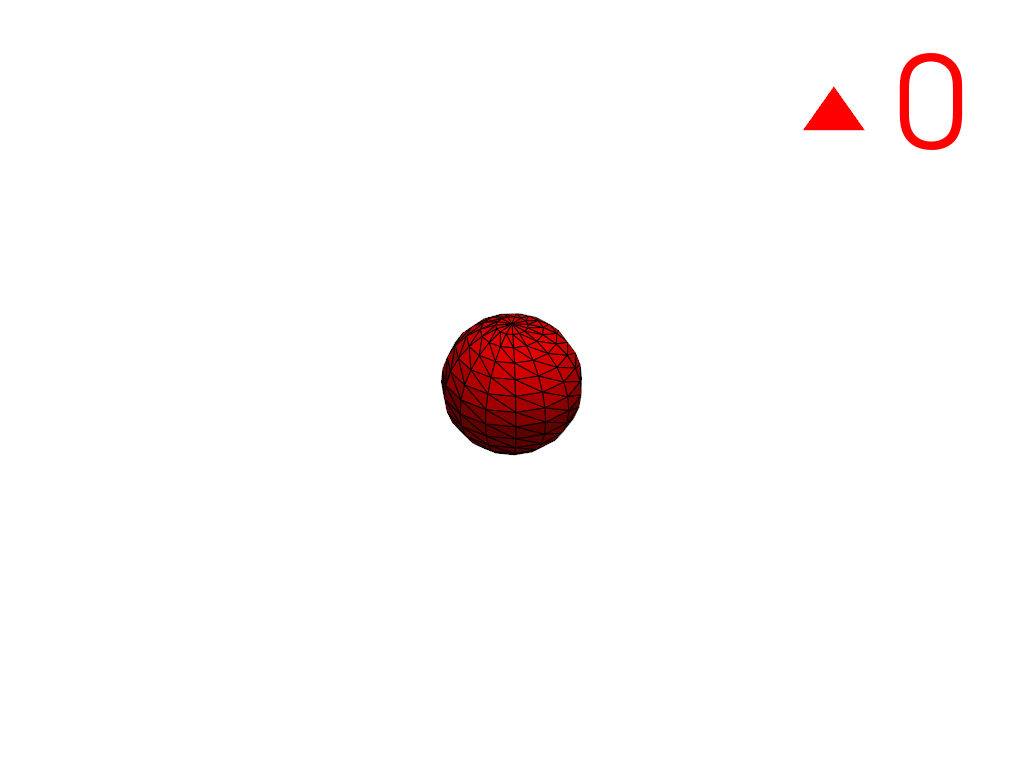
Extract a region using a cell ID
3100as a seed.>>> conn = mesh.connectivity('cell_seed', 3100) >>> pl = labels_plotter(conn) >>> pl.show()
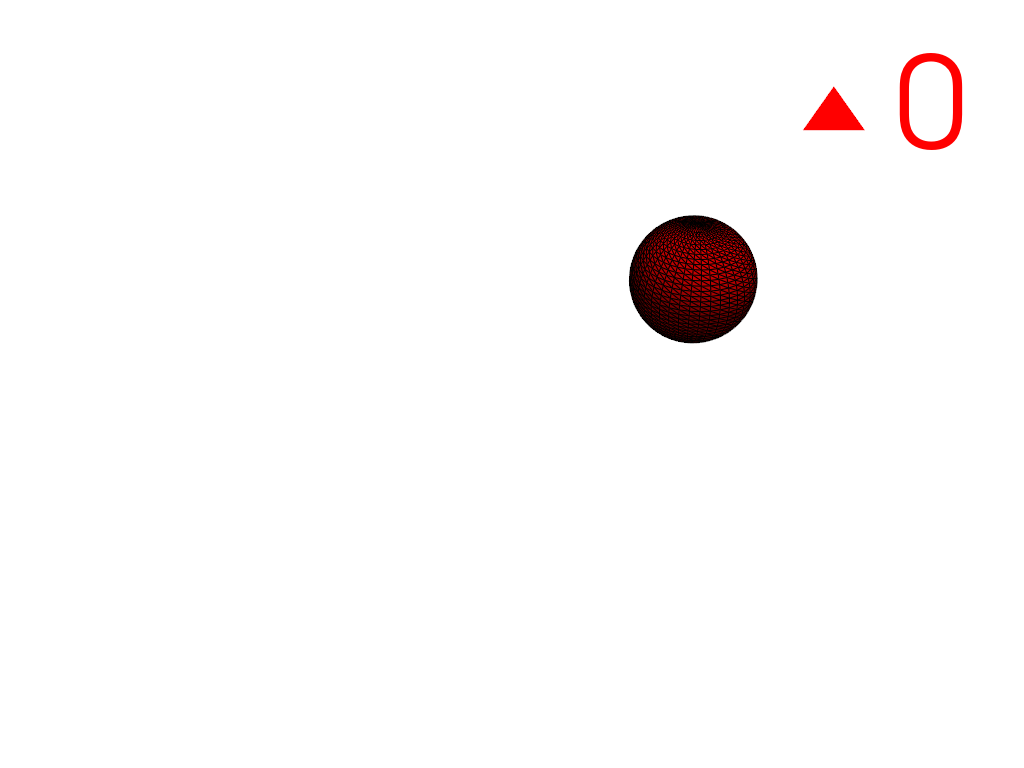
Extract the largest region.
>>> conn = mesh.connectivity('largest')
>>> pl = labels_plotter(conn)
>>> pl.show()
Extract the largest and smallest regions by specifying their region IDs. Note that the region IDs of the output differ from the specified IDs since the input has three regions but the output only has two.
>>> large_id = 0  # largest always has ID '0'
>>> small_id = 2  # smallest has ID 'N-1' with N=3 regions
>>> conn = mesh.connectivity('specified', (small_id, large_id))
>>> pl = labels_plotter(conn)
>>> pl.show()
