PointSet.plot#
- PointSet.plot(
- off_screen: bool | None = None,
- full_screen: bool | None = None,
- screenshot: str | bool | None = None,
- interactive: bool = True,
- cpos: CameraPositionOptions | None = None,
- window_size: list[int] | None = None,
- show_bounds: bool = False,
- show_axes: bool | None = None,
- notebook: bool | None = None,
- background: ColorLike | None = None,
- text: str = '',
- return_img: bool = False,
- eye_dome_lighting: bool = False,
- volume: bool = False,
- parallel_projection: bool = False,
- jupyter_backend: JupyterBackendOptions | None = None,
- return_viewer: bool = False,
- return_cpos: bool = False,
- jupyter_kwargs: dict | None = None,
- theme: Theme | None = None,
- anti_aliasing: Literal['ssaa', 'msaa', 'fxaa'] | bool | None = None,
- zoom: str | float | None = None,
- border: bool = False,
- border_color: ColorLike = 'k',
- border_width: float = 2.0,
- ssao: bool = False,
- **kwargs,
Plot a PyVista, numpy, or vtk object.
Added in version 0.47:
plotcan be invoked with the shell command:pyvista plot <files> --screenshot output.png --off-screen
Run
pyvista plot --helpfor more details on available parameters.Note
Providing multiple files renders them inside the same window.
- Parameters:
- var_item
pyvista.DataSet See
Plotter.add_meshfor all supported types.- off_screenbool,
optional Plots off screen when
True. Helpful for saving screenshots without a window popping up. Defaults to the global settingpyvista.OFF_SCREEN.- full_screenbool, default:
pyvista.plotting.themes.Theme.full_screen Opens window in full screen. When enabled, ignores
window_size.- screenshot
str| bool,optional Saves screenshot to file when enabled. See:
Plotter.screenshot(). DefaultFalse.When
True, takes screenshot and returnsnumpyarray of image.- interactivebool, default:
pyvista.plotting.themes.Theme.interactive Allows user to pan and move figure.
- cpos
CameraPositionOptions,optional List of camera position, focal point, and view up. See the
pyvista.Plotter.camera_positionfor concrete examples on how to use this parameter and Cameras for a detailed documentation onpyvista.Camera.- window_size
list[int], default:pyvista.plotting.themes.Theme.window_size Window size in pixels.
- show_boundsbool, default:
False Shows mesh bounds when
True.- show_axesbool, default:
pyvista.plotting.themes._AxesConfig.show Shows a vtk axes widget.
- notebookbool, default:
pyvista.plotting.themes.Theme.notebook When
True, the resulting plot is placed inline a jupyter notebook. Assumes a jupyter console is active.- background
ColorLike, default:pyvista.plotting.themes.Theme.background Color of the background.
- text
str,optional Adds text at the bottom of the plot.
- return_imgbool, default:
False Returns numpy array of the last image rendered.
- eye_dome_lightingbool,
optional Enables eye dome lighting.
- volumebool, default:
False Use the
Plotter.add_volume()method for volume rendering.- parallel_projectionbool, default:
False Enable parallel projection.
- jupyter_backend
JupyterBackendOptions,optional Jupyter notebook plotting backend to use. See available documentation at
pyvista.set_jupyter_backend()to see all valid values for this parameter along with a detailed documentation.Defaults to
pyvista.plotting.themes.Theme.jupyter_backend- return_viewerbool, default:
False Return the jupyterlab viewer, scene, or display object when plotting with jupyter notebook.
- return_cposbool, default:
False Return the last camera position from the render window when enabled. Defaults to value in theme settings.
- jupyter_kwargs
dict,optional Keyword arguments for the Jupyter notebook plotting backend. See Customize Trame toolbar for an example using this keyword.
- theme
pyvista.plotting.themes.Theme,optional Plot-specific theme.
- anti_aliasing
Literal[‘ssaa’, ‘msaa’, ‘fxaa’] | bool,optional Enable or disable anti-aliasing. If
True, uses"msaa". If False, disables anti_aliasing. If a string, should be one of the following:"ssaa"- Super-Sample Anti-Aliasing"msaa"- Multi-Sample Anti-Aliasing"fxaa"- Fast Approximate Anti-Aliasing
Defaults to
pyvista.plotting.themes.Theme.anti_aliasing- zoom
float|str,optional Camera zoom. Either
'tight'or a float. A value greater than 1 is a zoom-in, a value less than 1 is a zoom-out. Must be greater than 0.- borderbool, default:
False Draw a border around each render window.
- border_color
ColorLike, default: “k” Either a string, rgb list, or hex color string. For example:
color='white'color='w'color=[1.0, 1.0, 1.0]color='#FFFFFF'
- border_width
float, default: 2.0 Width of the border in pixels when enabled.
- ssaobool,
optional Enable surface space ambient occlusion (SSAO). See
Plotter.enable_ssao()for more details.- **kwargs
dict,optional See
pyvista.Plotter.add_mesh()for additional options.
- var_item
- Returns:
- cpos
list List of camera position, focal point, and view up. Returned only when
return_cpos=Trueor set in the default global or plot theme. Not returned when in a jupyter notebook andreturn_viewer=True.- image
np.ndarray Numpy array of the last image when either
return_img=Trueorscreenshot=Trueis set. Not returned when in a jupyter notebook withreturn_viewer=True. Optionally contains alpha values. Sized:[Window height x Window width x 3] if the theme sets
transparent_background=False.[Window height x Window width x 4] if the theme sets
transparent_background=True.
- widget
ipywidgets.Widget IPython widget when
return_viewer=True.
- cpos
Examples
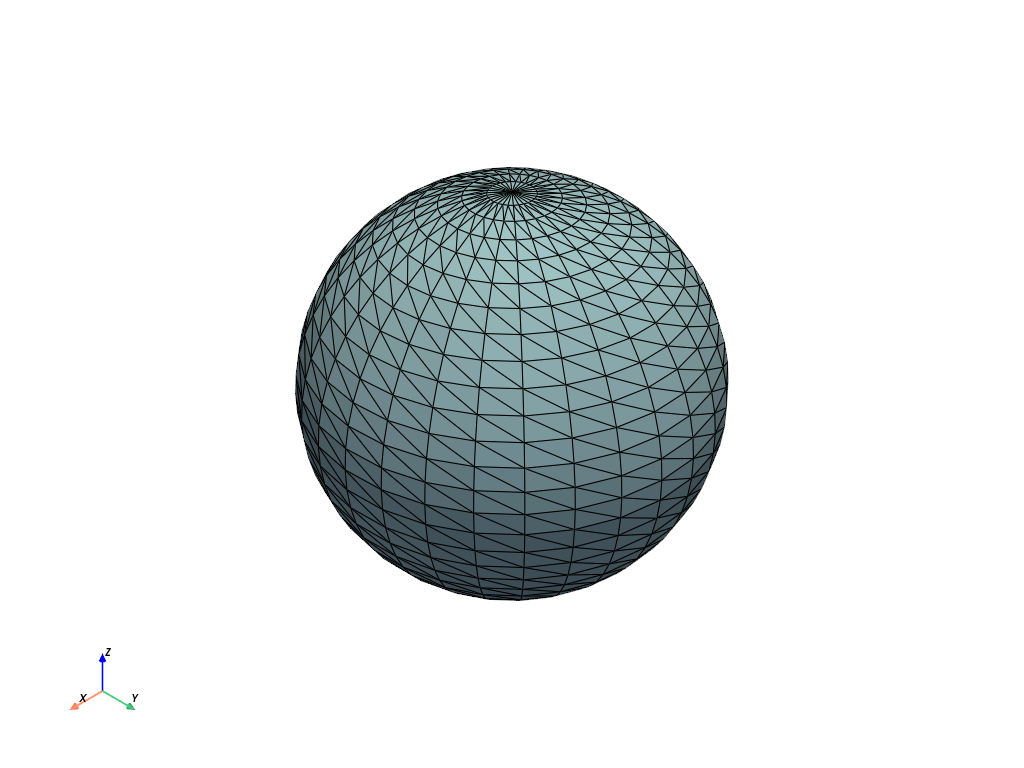
Plot a simple sphere while showing its edges.
>>> import pyvista as pv
>>> mesh = pv.Sphere()
>>> mesh.plot(show_edges=True)
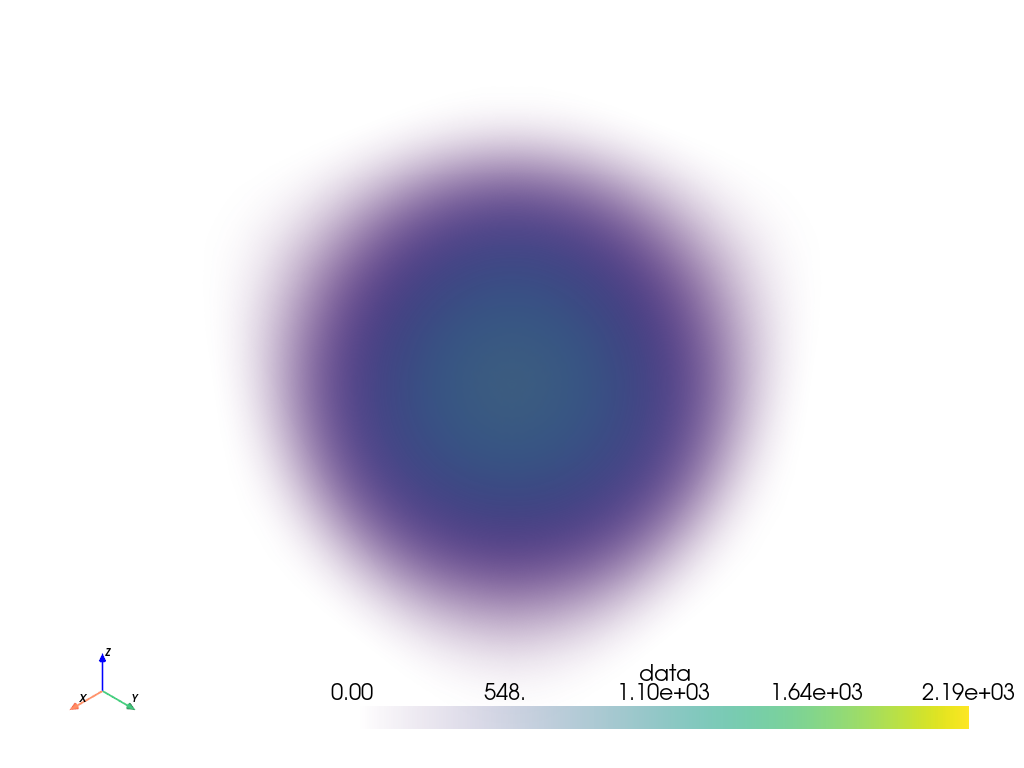
Plot a volume mesh. Color by distance from the center of the ImageData. Note
volume=Trueis passed.>>> import numpy as np >>> grid = pv.ImageData(dimensions=(32, 32, 32), spacing=(0.5, 0.5, 0.5)) >>> grid['data'] = np.linalg.norm(grid.center - grid.points, axis=1) >>> grid['data'] = np.abs(grid['data'] - grid['data'].max()) ** 3 >>> grid.plot(volume=True)