Chart2D.stack#
- Chart2D.stack(x, ys, colors=None, labels=None)[source]#
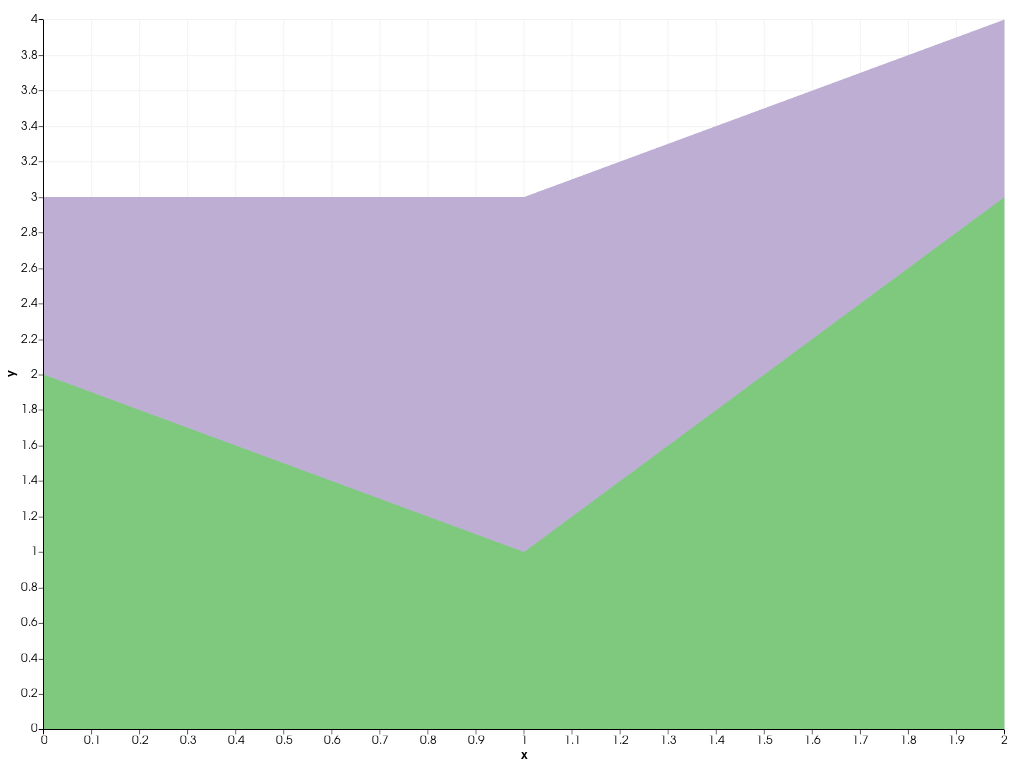
Add a stack plot to this chart.
- Parameters:
- xarray_like
X coordinates of the points outlining the stacks (areas) to draw.
- yssequence[array_like]
Size of the stacks (areas) to draw at the corresponding X coordinates. Each sequence defines the sizes of one stack (area), which are stacked on top of each other.
- colorssequence[
ColorLike],optional Color of the stacks (areas) drawn in this plot. Any color parsable by
pyvista.Coloris allowed.- labelssequence[
str], default: [] Label for each stack (area) drawn in this plot, as shown in the chart’s legend.
- Returns:
plotting.charts.StackPlotThe created stack plot.
Examples
Generate a stack plot.
>>> import pyvista as pv
>>> chart = pv.Chart2D()
>>> plot = chart.stack([0, 1, 2], [[2, 1, 3], [1, 2, 1]])
>>> chart.show()