pyvista.ChartBox.size#
- property ChartBox.size[source]#
Return or set the chart size in normalized coordinates.
A size of
(1, 1)occupies the whole renderer.Notes
Customisable ChartBox geometry is only supported in VTK v9.2 or newer. For older VTK versions, the size cannot be modified, filling up the entire viewport by default.
Examples
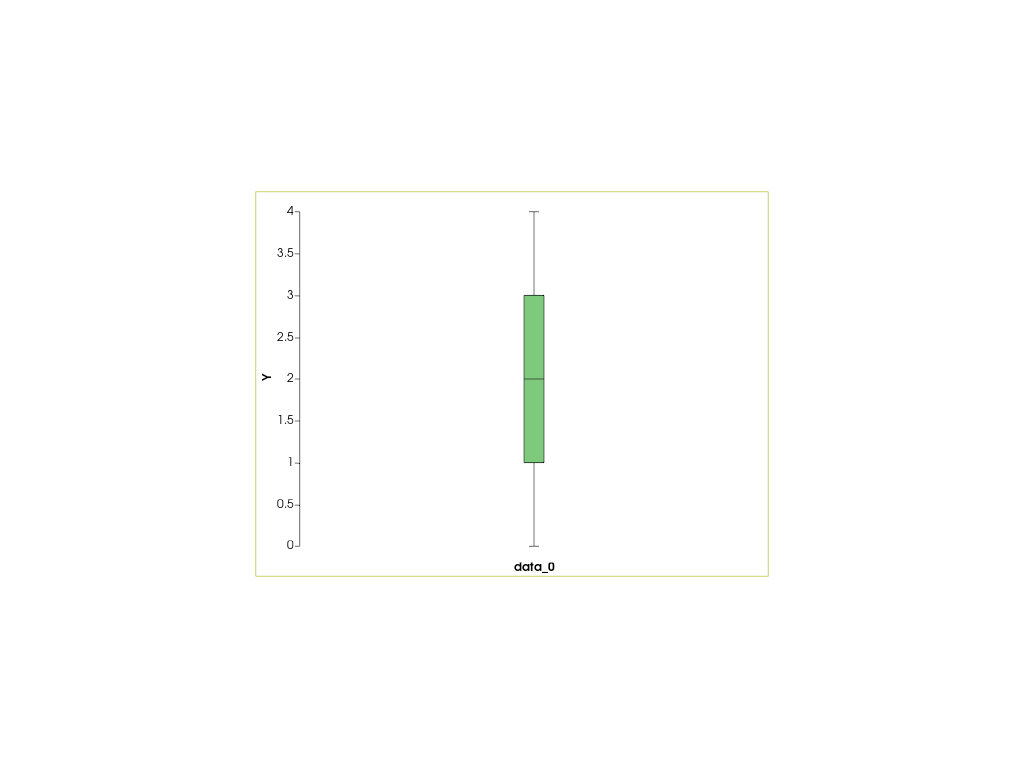
Create a half-sized boxplot chart centered in the middle of the renderer.
>>> import pyvista as pv
>>> chart = pv.ChartBox([[0, 1, 1, 2, 3, 3, 4]])
>>> chart.size = (0.5, 0.5)
>>> chart.loc = (0.25, 0.25)
>>> chart.show()