Wavelet#
- Wavelet(
- extent: VectorLike[float] = (-10, 10, -10, 10, -10, 10),
- center: VectorLike[float] = (0.0, 0.0, 0.0),
- maximum: float = 255.0,
- x_freq: float = 60.0,
- y_freq: float = 30.0,
- z_freq: float = 40.0,
- x_mag: float = 10.0,
- y_mag: float = 18.0,
- z_mag: float = 5.0,
- std: float = 0.5,
- subsample_rate: int = 1,
Create a wavelet.
Produces images with pixel values determined by
Maximum*Gaussian*x_mag*sin(x_freq*x)*sin(y_freq*y)*cos(z_freq*z)Values are float scalars on point data with name
"RTData".- Parameters:
- extentsequence[
int], default: (-10, 10, -10, 10, -10, 10) Set/Get the extent of the whole output image.
- centersequence[
float], default: (0.0, 0.0, 0.0) Center of the wavelet.
- maximum
float, default: 255.0 Maximum of the wavelet function.
- x_freq
float, default: 60.0 Natural frequency in the x direction.
- y_freq
float, default: 30.0 Natural frequency in the y direction.
- z_freq
float, default: 40.0 Natural frequency in the z direction.
- x_mag
float, default: 10.0 Magnitude in the x direction.
- y_mag
float, default: 18.0 Magnitude in the y direction.
- z_mag
float, default: 5.0 Magnitude in the z direction.
- std
float, default: 0.5 Standard deviation.
- subsample_rate
int, default: 1 The sub-sample rate.
- extentsequence[
- Returns:
pyvista.ImageDataWavelet mesh.
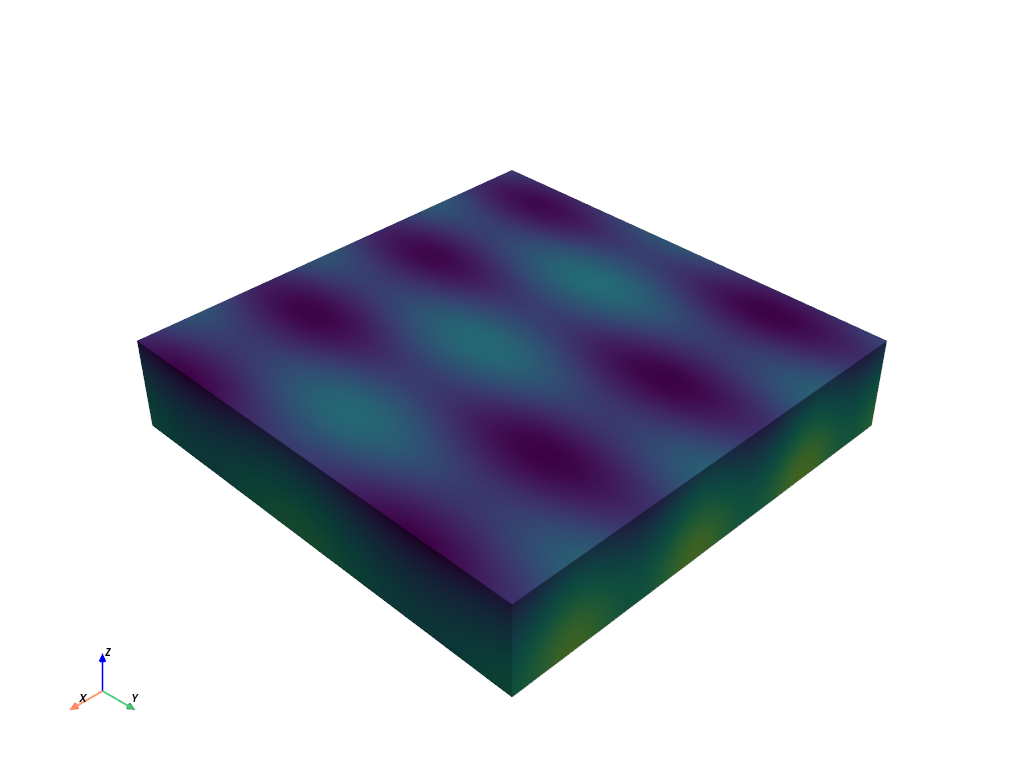
Examples
>>> import pyvista as pv
>>> wavelet = pv.Wavelet(
...     extent=(0, 50, 0, 50, 0, 10),
...     x_freq=20,
...     y_freq=10,
...     z_freq=1,
...     x_mag=100,
...     y_mag=100,
...     z_mag=1000,
... )
>>> wavelet.plot(show_scalar_bar=False)
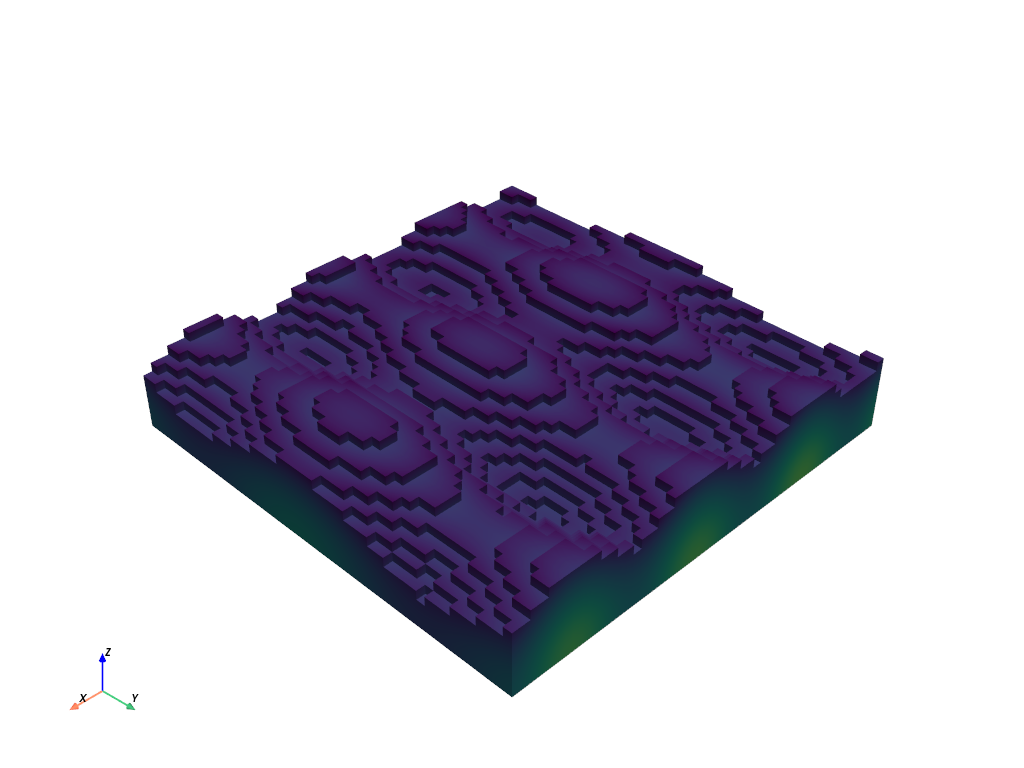
Extract lower valued cells of the wavelet and create a surface from it.
>>> thresh = wavelet.threshold(800).extract_surface(algorithm=None)
>>> thresh.plot(show_scalar_bar=False)
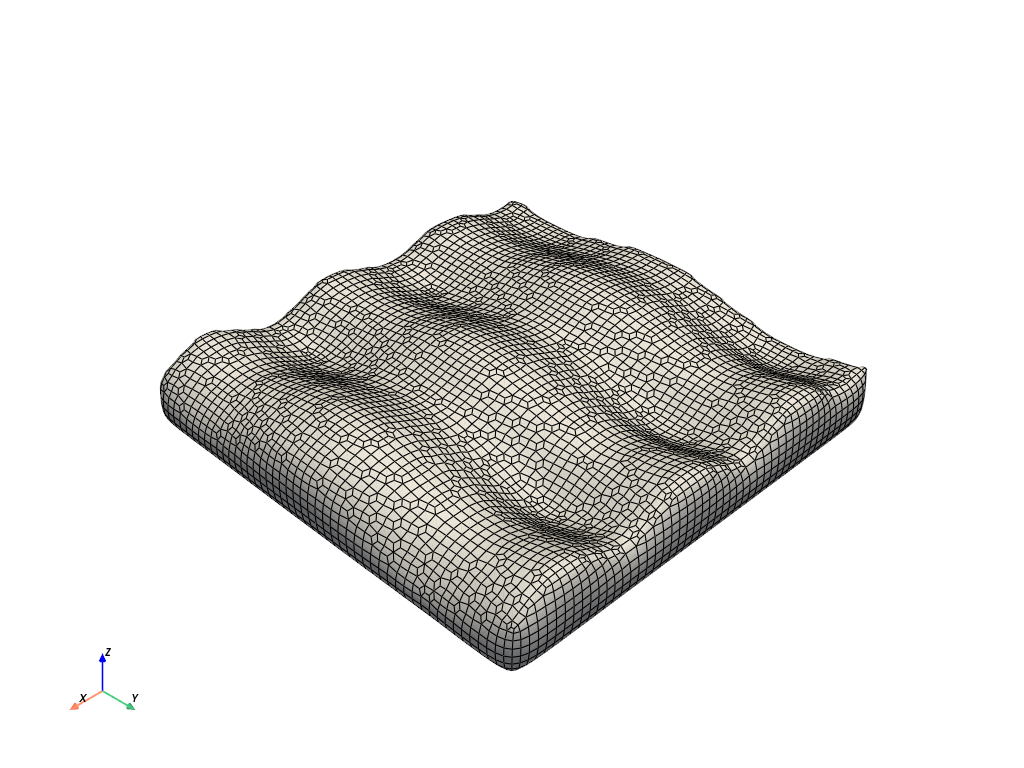
Smooth it to create “waves”
>>> waves = thresh.smooth(n_iter=100, relaxation_factor=0.1)
>>> waves.plot(color='white', smooth_shading=True, show_edges=True)