Note
Go to the end to download the full example code.
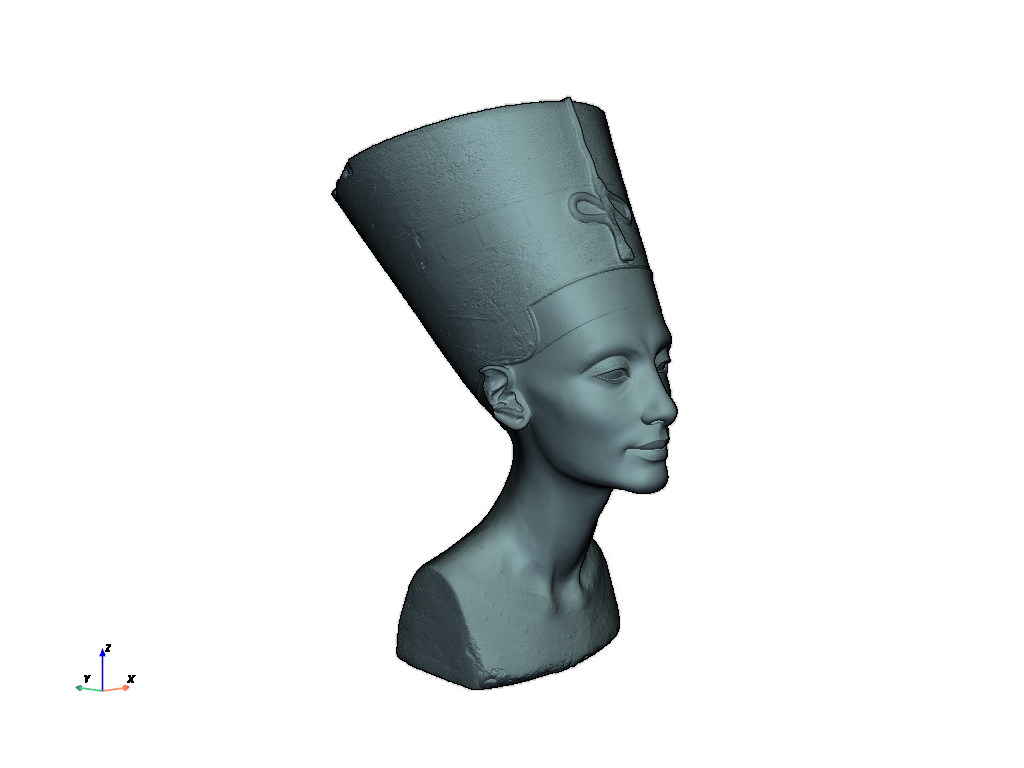
Eye Dome Lighting#
Eye-Dome Lighting (EDL) is a non-photorealistic, image-based shading technique designed to improve depth perception in scientific visualization images. It darkens each pixel based on how much nearer its neighbors are in screen space, which makes depth ordering readable even on flat-shaded geometry or unshaded point clouds. To learn more, see this blog post.
EDL is most useful when standard Lambertian shading is insufficient, for example:
Point clouds, which have no surface normals to shade from.
Dense or intertwined geometry where overlapping surfaces collapse into a visually flat mass.
Noisy or raw-scanned meshes with many features at similar depths.
Dense branching geometry#
The VTK pine root scan is a classic EDL demonstration dataset: a dense tangle of fine branching structures where depth ordering is hard to read without extra shading cues.
import pyvista as pv
from pyvista import examples


pine_roots = examples.download_pine_roots()
pine_roots.plot(eye_dome_lighting=True, color='tan')
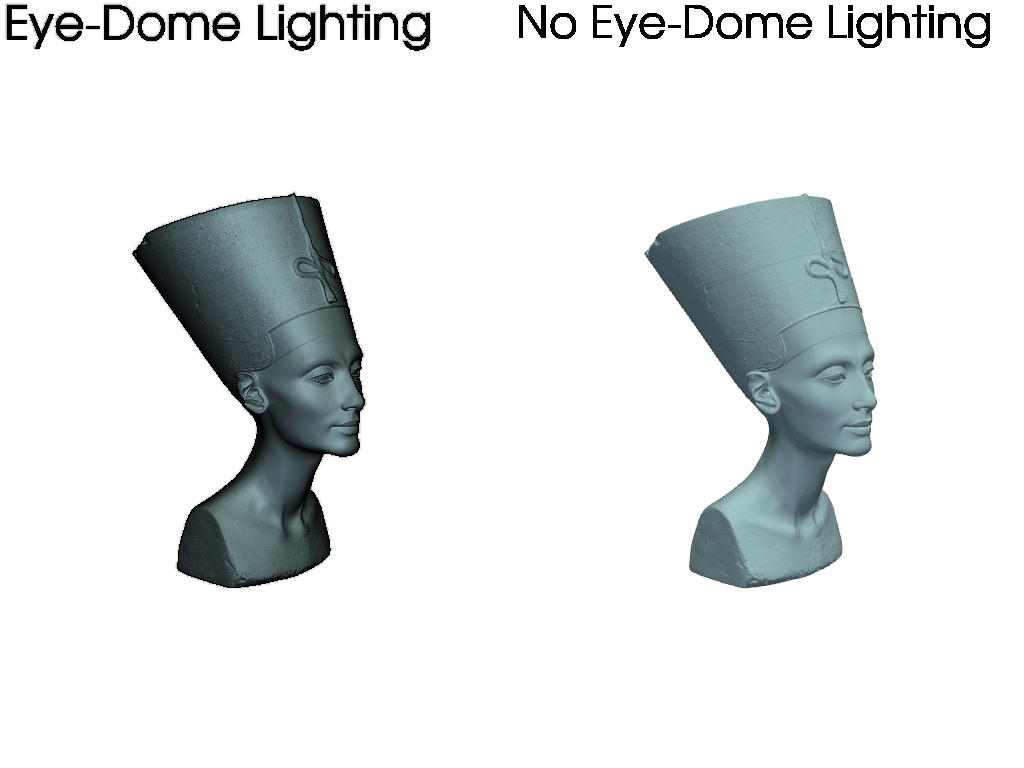
Compare EDL shading side by side with standard shading. The left panel is rendered with EDL, the right without. EDL reveals which roots lie in front of which; without it, they collapse into a flat silhouette.
pl = pv.Plotter(shape=(1, 2), border=False)

pl.subplot(0, 0)
pl.add_mesh(pine_roots, color='tan')
pl.enable_eye_dome_lighting()
pl.add_text('Eye-Dome Lighting', font_size=24)

pl.subplot(0, 1)
pl.add_mesh(pine_roots, color='tan')
pl.add_text('No Eye-Dome Lighting', font_size=24)

pl.link_views()
pl.show()
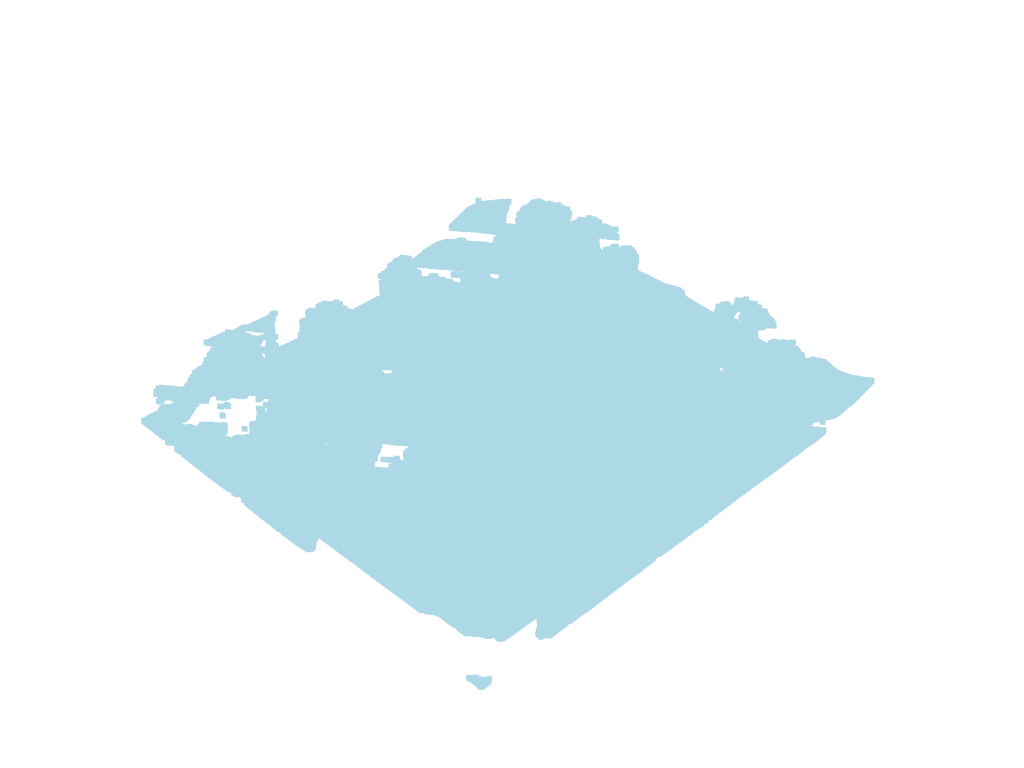
Point cloud#
EDL was originally motivated by the problem of shading point clouds, which have no surface normals for traditional lighting. This Lidar point cloud looks ambiguous without shading hints:
point_cloud = examples.download_lidar()

pl = pv.Plotter()
pl.add_mesh(point_cloud, color='lightblue', point_size=5)
pl.show()
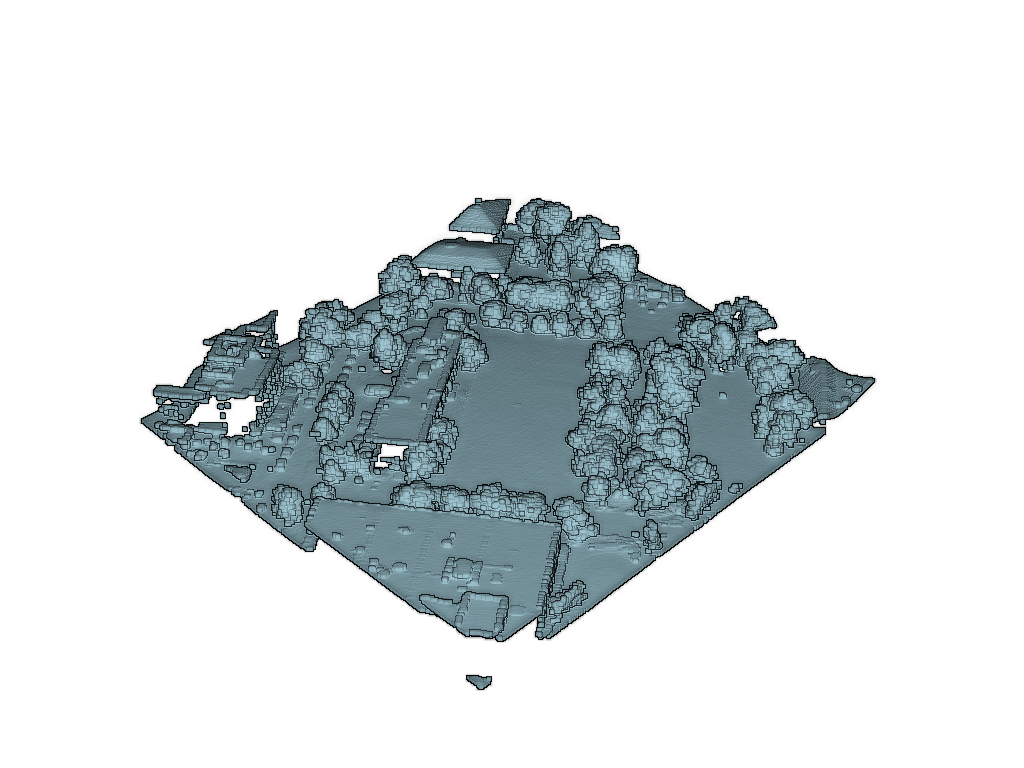
Enable EDL on the renderer via
pyvista.Renderer.enable_eye_dome_lighting() and the terrain structure
becomes readable.
pl = pv.Plotter()
pl.add_mesh(point_cloud, color='lightblue', point_size=5)
pl.enable_eye_dome_lighting()
pl.show()
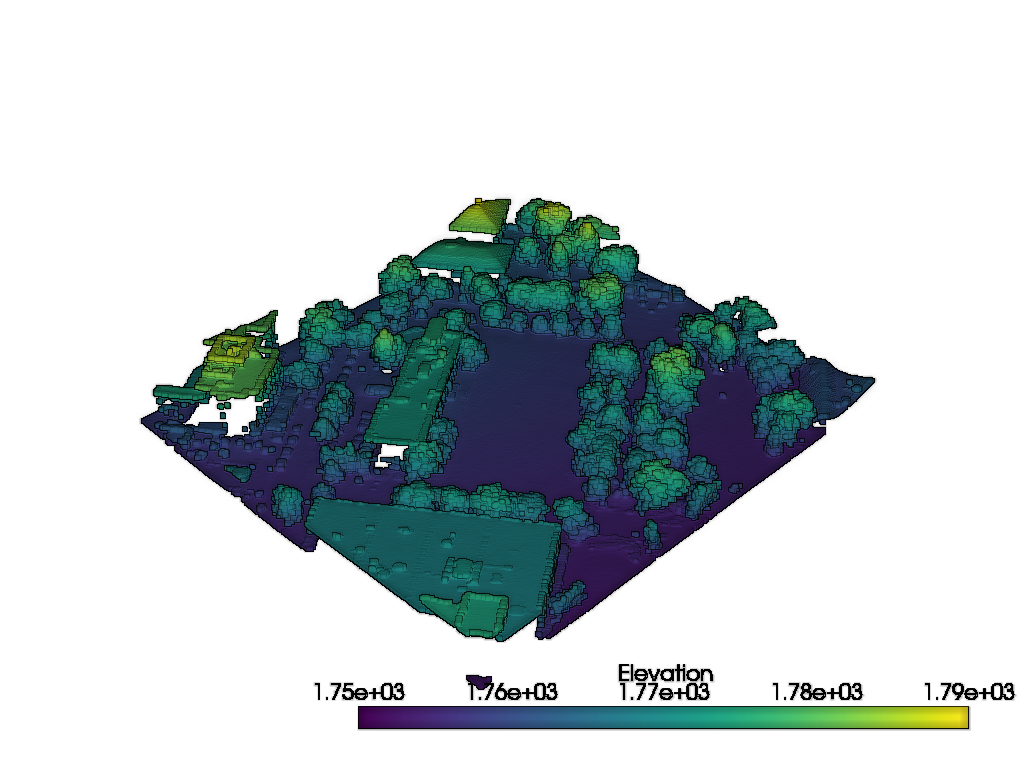
EDL also works alongside scalar coloring:
pl = pv.Plotter()
pl.add_mesh(point_cloud, scalars='Elevation', point_size=5)
pl.enable_eye_dome_lighting()
pl.show()
Total running time of the script: (0 minutes 31.467 seconds)
