PolyDataFilters.plot_curvature#
- PolyDataFilters.plot_curvature(curv_type='mean', **kwargs)[source]#
Plot the curvature.
- Parameters:
- curv_type
str, default: “mean” One of the following strings indicating curvature type:
'mean''gaussian''maximum''minimum'
- **kwargs
dict,optional See
pyvista.plot().
- curv_type
- Returns:
pyvista.CameraPositionList of camera position, focal point, and view up. Returned when
return_cposisTrue.
Examples
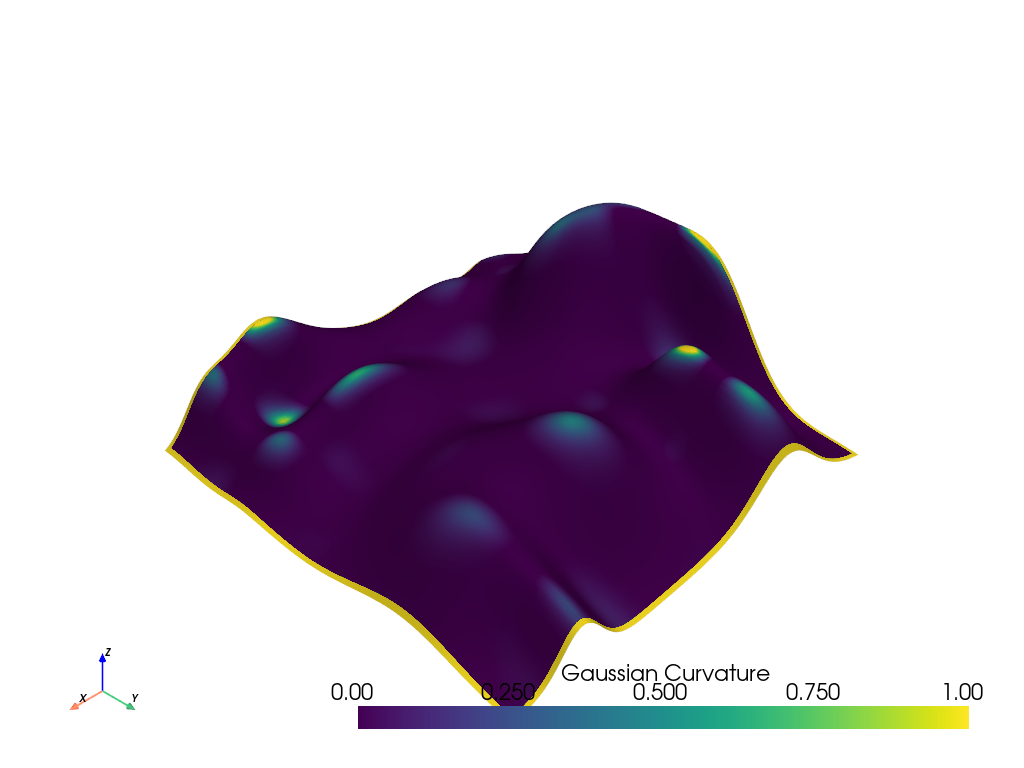
Plot the Gaussian curvature of an example mesh. Override the default scalar bar range as the mesh edges report high curvature.
>>> from pyvista import examples
>>> hills = examples.load_random_hills()
>>> hills.plot_curvature(
...     curv_type='gaussian', smooth_shading=True, clim=[0, 1]
... )