pyvista.DataSetFilters.sample_over_circular_arc#
- DataSetFilters.sample_over_circular_arc(
- pointa: VectorLike[float],
- pointb: VectorLike[float],
- center: VectorLike[float],
- resolution: int | None = None,
- tolerance: float | None = None,
- progress_bar: bool = False,
Sample a dataset over a circular arc.
- Parameters:
- pointasequence[
float] Location in
[x, y, z].- pointbsequence[
float] Location in
[x, y, z].- centersequence[
float] Location in
[x, y, z].- resolution
int,optional Number of pieces to divide circular arc into. Defaults to number of cells in the input mesh. Must be a positive integer.
- tolerance
float,optional Tolerance used to compute whether a point in the source is in a cell of the input. If not given, tolerance is automatically generated.
- progress_barbool, default:
False Display a progress bar to indicate progress.
- pointasequence[
- Returns:
pyvista.PolyDataArc containing the sampled data.
Examples
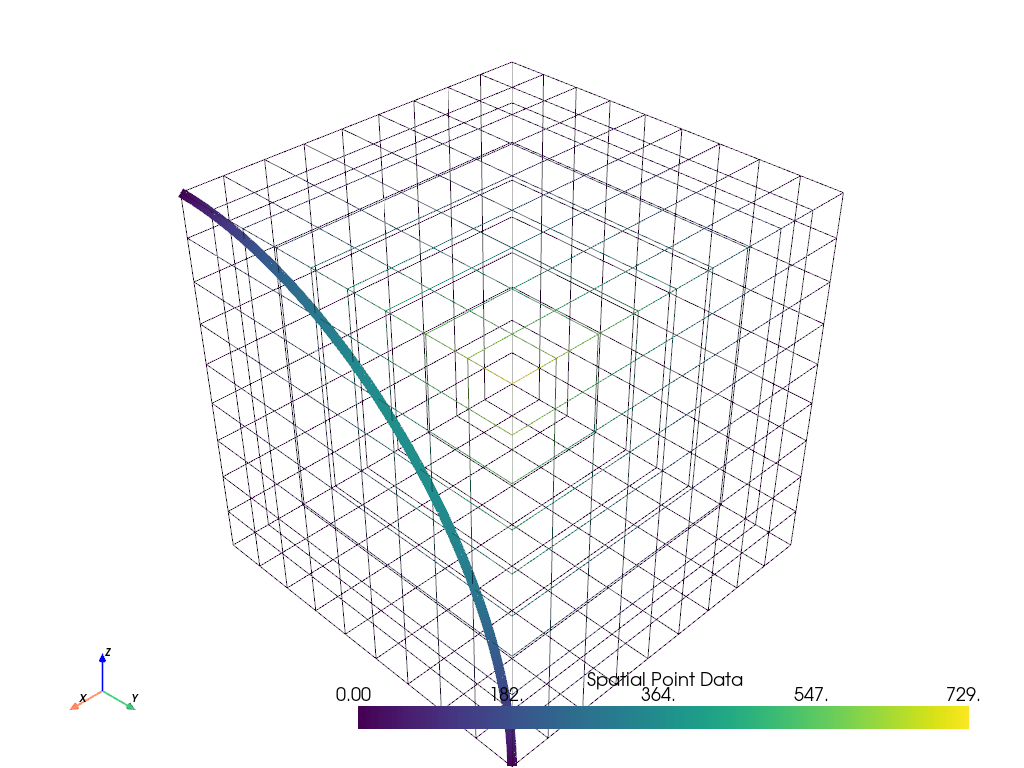
Sample a dataset over a circular arc and plot it.
>>> import pyvista as pv
>>> from pyvista import examples
>>> uniform = examples.load_uniform()
>>> uniform['height'] = uniform.points[:, 2]
>>> pointa = [
...     uniform.bounds.x_max,
...     uniform.bounds.y_min,
...     uniform.bounds.z_max,
... ]
>>> pointb = [
...     uniform.bounds.x_max,
...     uniform.bounds.y_max,
...     uniform.bounds.z_min,
... ]
>>> center = [
...     uniform.bounds.x_max,
...     uniform.bounds.y_min,
...     uniform.bounds.z_min,
... ]
>>> sampled_arc = uniform.sample_over_circular_arc(pointa, pointb, center)
>>> pl = pv.Plotter()
>>> _ = pl.add_mesh(uniform, style='wireframe')
>>> _ = pl.add_mesh(sampled_arc, line_width=10)
>>> pl.show_axes()
>>> pl.show()