pyvista.PolyDataFilters.plot_boundaries#
- PolyDataFilters.plot_boundaries(
- edge_color='red',
- line_width=None,
- progress_bar: bool = False,
- **kwargs,
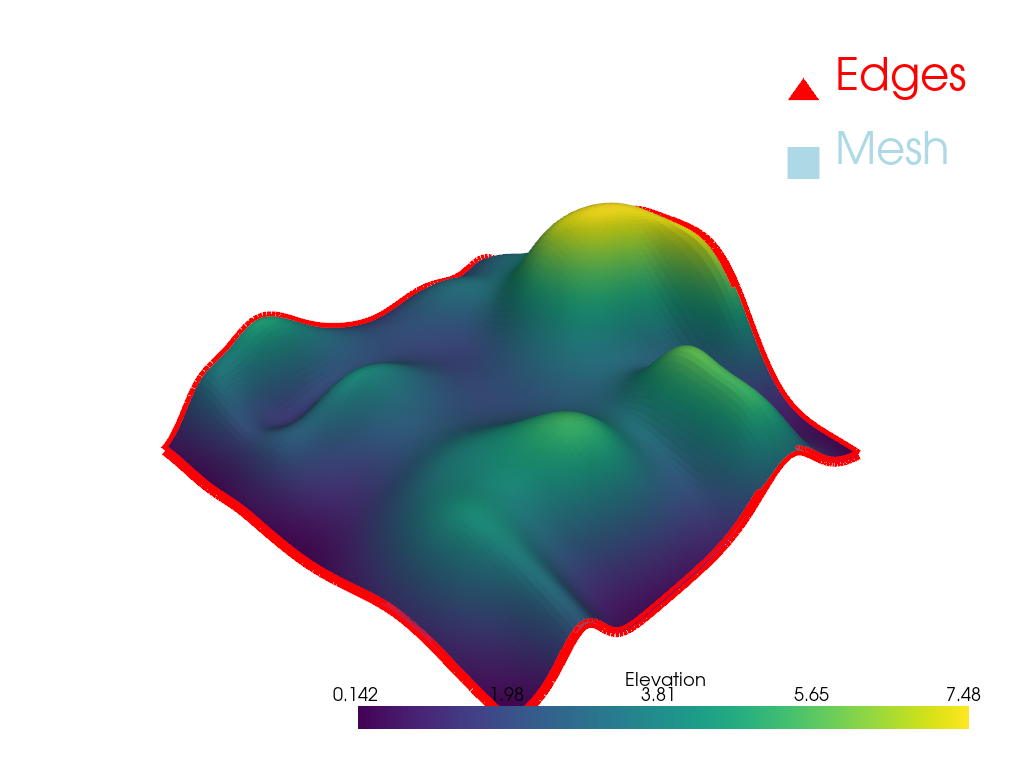
Plot boundaries of a mesh.
- Parameters:
- edge_color
ColorLike, default: “red” The color of the edges when they are added to the plotter.
- line_width
int,optional Width of the boundary lines.
- progress_barbool, default:
False Display a progress bar to indicate progress.
- **kwargs
dict,optional All additional keyword arguments will be passed to
pyvista.Plotter.add_mesh().
- edge_color
- Returns:
pyvista.CameraPositionList of camera position, focal point, and view up. Returned when
return_cposisTrue.
Examples
>>> from pyvista import examples
>>> hills = examples.load_random_hills()
>>> hills.plot_boundaries(line_width=10)