PolyDataFilters.plot_normals#
- PolyDataFilters.plot_normals(
- show_mesh: bool = True,
- mag=1.0,
- flip: bool = False,
- use_every=1,
- faces: bool = False,
- color=None,
- **kwargs,
Plot the point normals of a mesh.
- Parameters:
- show_meshbool, default:
True Plot the mesh itself.
- mag
float, default: 1.0 Size magnitude of the normal arrows.
- flipbool, default:
False Flip the normal direction when
True.- use_every
int, default: 1 Display every nth normal. By default every normal is displayed. Display every 10th normal by setting this parameter to 10.
- facesbool, default:
False Plot face normals instead of the default point normals.
- color
ColorLike,optional Color of the arrows. Defaults to
pyvista.plotting.themes.Theme.edge_color.- **kwargs
dict,optional All additional keyword arguments will be passed to
pyvista.Plotter.add_mesh().
- show_meshbool, default:
- Returns:
pyvista.CameraPositionList of camera position, focal point, and view up. Returned when
return_cposisTrue.
Examples
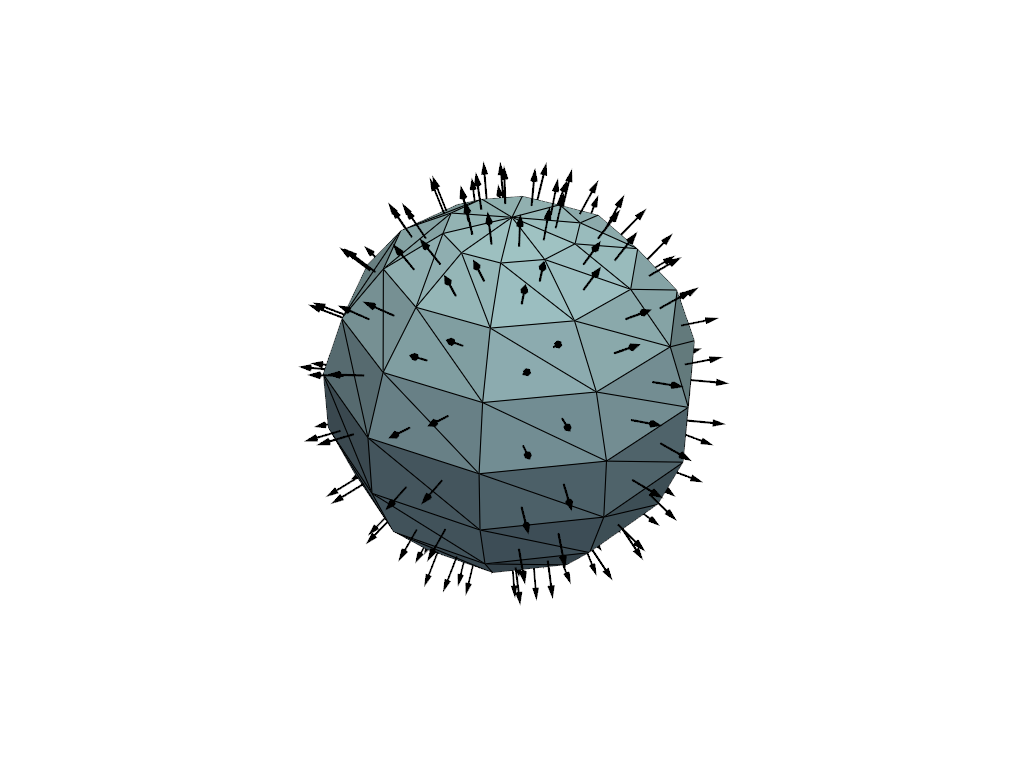
Plot the point normals of a sphere.
>>> import pyvista as pv
>>> sphere = pv.Sphere(phi_resolution=10, theta_resolution=10)
>>> sphere.plot_normals(mag=0.1, show_edges=True)
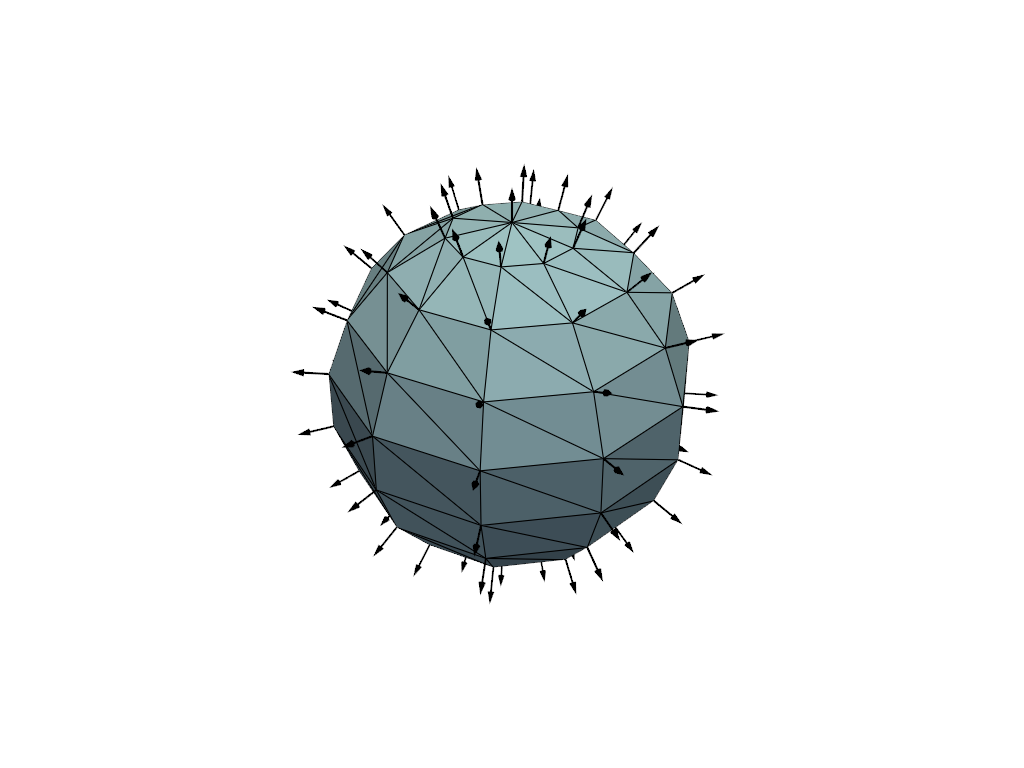
Plot the face normals of a sphere.
>>> import pyvista as pv
>>> sphere = pv.Sphere(phi_resolution=10, theta_resolution=10)
>>> sphere.plot_normals(mag=0.1, faces=True, show_edges=True)