pyvista.Plotter.add_legend_scale#
- Plotter.add_legend_scale(
- corner_offset_factor=2.0,
- bottom_border_offset=30,
- top_border_offset=30,
- left_border_offset=30,
- right_border_offset=30,
- bottom_axis_visibility=True,
- top_axis_visibility=True,
- left_axis_visibility=True,
- right_axis_visibility=True,
- legend_visibility=True,
- xy_label_mode=False,
- render=True,
- color=None,
- font_size_factor=0.6,
- label_size_factor=1.0,
- label_format=None,
- number_minor_ticks=0,
- tick_length=5,
- minor_tick_length=3,
- show_ticks=True,
- tick_label_offset=2,
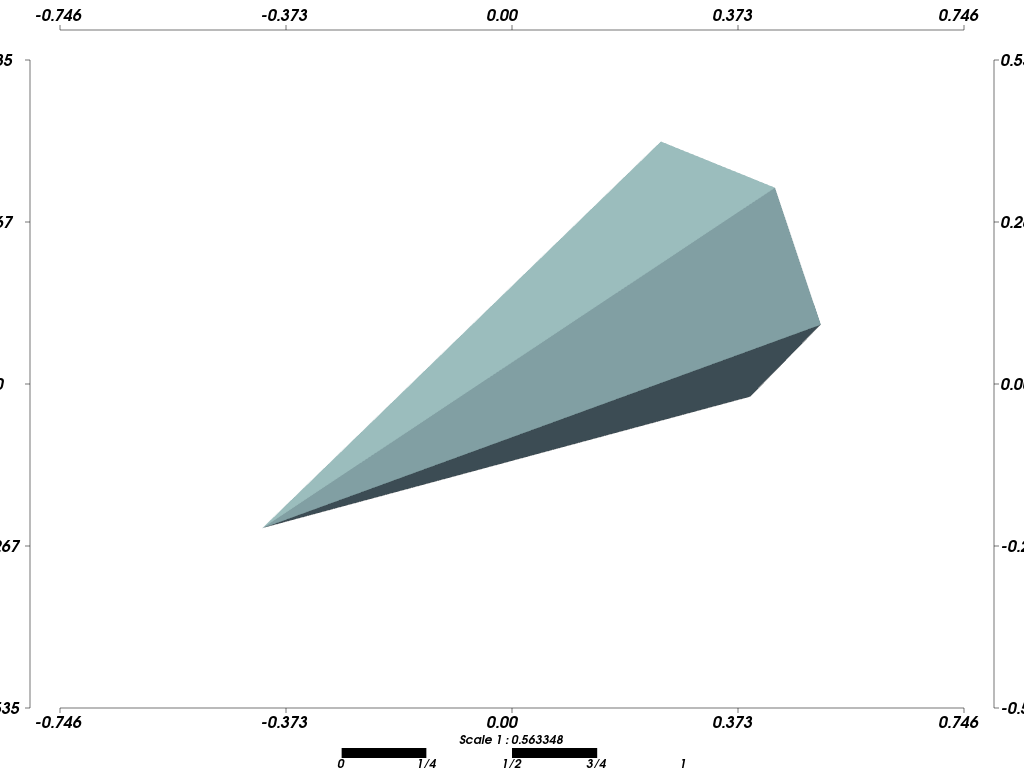
Annotate the render window with scale and distance information.
Its basic goal is to provide an indication of the scale of the scene. Four axes surrounding the render window indicate (in a variety of ways) the scale of what the camera is viewing. An option also exists for displaying a scale legend.
- Parameters:
- corner_offset_factor
float, default: 2.0 The corner offset value.
- bottom_border_offset
int, default: 30 Bottom border offset. Recommended value
50.- top_border_offset
int, default: 30 Top border offset. Recommended value
50.- left_border_offset
int, default: 30 Left border offset. Recommended value
100.- right_border_offset
int, default: 30 Right border offset. Recommended value
100.- bottom_axis_visibilitybool, default:
True Whether the bottom axis is visible.
- top_axis_visibilitybool, default:
True Whether the top axis is visible.
- left_axis_visibilitybool, default:
True Whether the left axis is visible.
- right_axis_visibilitybool, default:
True Whether the right axis is visible.
- legend_visibilitybool, default:
True Whether the legend scale is visible.
- xy_label_modebool, default:
False The axes can be programmed either to display distance scales or x-y coordinate values. By default, the scales display a distance. However, if you know that the view is down the z-axis, the scales can be programmed to display x-y coordinate values.
- renderbool, default:
True Whether to render when the actor is added.
- color
ColorLike,optional Either a string, rgb list, or hex color string for tick text and tick line colors.
Warning
The axis labels tend to be either white or black.
- font_size_factor
float, default: 0.6 Factor to scale font size overall.
- label_size_factor
float, default: 1.0 Factor to scale label size relative to title size.
- label_format
str,optional A printf style format for labels, e.g.
'%E'. See printf-style String Formatting.- number_minor_ticks
int, default: 0 Number of minor ticks between major ticks.
- tick_length
int, default: 5 Length of ticks in pixels.
- minor_tick_length
int, default: 3 Length of minor ticks in pixels.
- show_ticksbool, default:
True Whether to show the ticks.
- tick_label_offset
int, default: 2 Offset between tick and label in pixels.
- corner_offset_factor
- Returns:
- vtkActor
The actor for the added vtkLegendScaleActor.
Warning
Please be aware that the axes and scale values are subject to perspective effects. The distances are computed in the focal plane of the camera. When there are large view angles (i.e., perspective projection), the computed distances may provide users the wrong sense of scale. These effects are not present when parallel projection is enabled.
Examples
>>> import pyvista as pv
>>> cone = pv.Cone(height=2.0, radius=0.5)
>>> pl = pv.Plotter()
>>> _ = pl.add_mesh(cone)
>>> _ = pl.add_legend_scale()
>>> pl.show()
