Plotter.add_volume#
- Plotter.add_volume(
- volume: DataSet | MultiBlock | NumpyArray[float],
- scalars: str | NumpyArray[float] | None = None,
- clim: float | tuple[float, float] | None = None,
- resolution: VectorLike[float] | None = None,
- opacity: OpacityOptions | NumpyArray[float] = 'linear',
- n_colors: int = 256,
- cmap: ColormapOptions | LookupTable | None = None,
- flip_scalars: bool = False,
- reset_camera: bool | None = None,
- name: str | None = None,
- ambient: float | None = None,
- categories: bool | int = False,
- culling: CullingOptions | bool = False,
- multi_colors: bool = False,
- blending: Literal['additive', 'maximum', 'minimum', 'composite', 'average'] = 'composite',
- mapper: Literal['fixed_point', 'gpu', 'open_gl', 'smart', 'ugrid'] | None = None,
- scalar_bar_args: ScalarBarArgs | None = None,
- show_scalar_bar: bool | None = None,
- annotations: dict[float, str] | None = None,
- pickable: bool = True,
- preference: PointLiteral | CellLiteral = 'point',
- opacity_unit_distance: float | None = None,
- shade: bool = False,
- diffuse: float = 0.7,
- specular: float = 0.2,
- specular_power: float = 10.0,
- render: bool | None = True,
- user_matrix: TransformLike | None = None,
- log_scale: bool = False,
- **kwargs,
Add a volume, rendered using a smart mapper by default.
Requires a 3D data type like
numpy.ndarray,pyvista.ImageData,pyvista.RectilinearGrid, orpyvista.UnstructuredGrid.- Parameters:
- volume3D
numpy.ndarray|DataSet The input volume to visualize. 3D numpy arrays are accepted.
Warning
If the input is not
numpy.ndarray,pyvista.ImageData, orpyvista.RectilinearGrid, volume rendering will often have poor performance.- scalars
str|numpy.ndarray,optional Scalars used to “color” the mesh. Accepts a string name of an array that is present on the mesh or an array with length equal to the number of cells or the number of points in the mesh. If
scalarsisNone, then the active scalars are used.Scalars may be 1 dimensional or 2 dimensional. If 1 dimensional, the scalars will be mapped to the lookup table. If 2 dimensional the scalars will be directly mapped to RGBA values, array should be shaped
(N, 4)whereNis the number of points, and of datatypenp.uint8.- climsequence[
float] |float,optional Color bar range for scalars. For example:
[-1, 2]. Defaults to minimum and maximum of scalars array if the scalars dtype is notnp.uint8.rngis also an accepted alias for this parameter.If the scalars datatype is
np.uint8, this parameter defaults to[0, 256].If a single value is given, the range
[-clim, clim]is used.- resolution
list,optional Block resolution. For example
[1, 1, 1]. Resolution must be non-negative. While VTK accepts negative spacing, this results in unexpected behavior. See: pyvista #1967.- opacity
str|numpy.ndarray,optional Opacity mapping for the scalars array.
A string can also be specified to map the scalars range to a predefined opacity transfer function. Or you can pass a custom made transfer function that is an array either
n_colorsin length or array, or you can pass a string to select a built in transfer function. If a string, should be one of the following:'linear'- Linear'linear_r'- Linear except reversed'geom'- Evenly spaced on the log scale'geom_r'- Evenly spaced on the log scale except reversed'sigmoid'- Linear map between -10.0 and 10.0'sigmoid_1'- Linear map between -1.0 and 1.0'sigmoid_2'- Linear map between -2.0 and 2.0'sigmoid_3'- Linear map between -3.0 and 3.0'sigmoid_4'- Linear map between -4.0 and 4.0'sigmoid_5'- Linear map between -5.0 and 5.0'sigmoid_6'- Linear map between -6.0 and 6.0'sigmoid_7'- Linear map between -7.0 and 7.0'sigmoid_8'- Linear map between -8.0 and 8.0'sigmoid_9'- Linear map between -9.0 and 9.0'sigmoid_10'- Linear map between -10.0 and 10.0'sigmoid_15'- Linear map between -15.0 and 15.0'sigmoid_20'- Linear map between -20.0 and 20.0'foreground'- Transparent background and opaque foreground.Intended for use with segmentation labels. Assumes the smallest scalar value of the array is the background value (e.g. 0).
If RGBA scalars are provided, this parameter is set to
'linear'to ensure the opacity transfer function has no effect on the input opacity values.- n_colors
int,optional Number of colors to use when displaying scalars. Defaults to 256. The scalar bar will also have this many colors.
- cmap
str|list|LookupTable, default:pyvista.plotting.themes.Theme.cmap If a string, this is the name of the
matplotlibcolormap to use when mapping thescalars. See Named Colormaps for supported colormaps.Only applicable for when displaying
scalars.colormapis also an accepted alias for this. Ifcolorcetorcmoceanare installed, their colormaps can be specified by name.You can also specify a list of colors to override an existing colormap with a custom one. For example, to create a three color colormap you might specify
['green', 'red', 'blue'].This parameter also accepts a
pyvista.LookupTable. If this is set, all parameters controlling the color map liken_colorswill be ignored.- flip_scalarsbool,
optional Flip direction of cmap. Most colormaps allow
*_rsuffix to do this as well.- reset_camerabool,
optional Reset the camera after adding this mesh to the scene.
- name
str,optional The name for the added actor so that it can be easily updated. If an actor of this name already exists in the rendering window, it will be replaced by the new actor.
- ambient
float,optional When lighting is enabled, this is the amount of light from 0 to 1 that reaches the actor when not directed at the light source emitted from the viewer. Default 0.0.
- categoriesbool,
optional If set to
True, then the number of unique values in the scalar array will be used as then_colorsargument.- culling
str,optional Does not render faces that are culled. Options are
'front'or'back'. This can be helpful for dense surface meshes, especially when edges are visible, but can cause flat meshes to be partially displayed. DefaultsFalse.- multi_colorsbool,
optional Whether or not to use multiple colors when plotting MultiBlock object. Blocks will be colored sequentially as ‘Reds’, ‘Greens’, ‘Blues’, and ‘Grays’.
- blending
str,optional Blending mode for visualisation of the input object(s). Can be one of ‘additive’, ‘maximum’, ‘minimum’, ‘composite’, or ‘average’. Defaults to ‘composite’.
- mapper
str,optional Volume mapper to use given by name. Options include:
'fixed_point','gpu','open_gl','smart', and'ugrid'. IfNonethe"volume_mapper"in theself._themeis used. If using'fixed_point', onlyImageDatatypes can be used.Note
If a
pyvista.UnstructuredGridis input, the ‘ugrid’ mapper (vtkUnstructuredGridVolumeRayCastMapper) will be used regardless.Note
The
'smart'mapper chooses one of the other listed mappers based on rendering parameters and available hardware. Most of the time the'smart'simply checks if a GPU is available and if so, uses the'gpu'mapper, otherwise using the'fixed_point'mapper.Warning
The
'fixed_point'mapper is CPU-based and will have lower performance than the'gpu'or'open_gl'mappers.- scalar_bar_args
dict,optional Dictionary of keyword arguments to pass when adding the scalar bar to the scene. For options, see
pyvista.Plotter.add_scalar_bar().- show_scalar_barbool
If
False, a scalar bar will not be added to the scene. Defaults toTrue.- annotations
dict,optional Pass a dictionary of annotations. Keys are the float values in the scalars range to annotate on the scalar bar and the values are the string annotations.
- pickablebool,
optional Set whether this mesh is pickable.
- preference
str,optional When
mesh.n_points == mesh.n_cellsand setting scalars, this parameter sets how the scalars will be mapped to the mesh. Default'point', causes the scalars will be associated with the mesh points. Can be either'point'or'cell'.- opacity_unit_distance
float,optional Set/Get the unit distance on which the scalar opacity transfer function is defined. Meaning that over that distance, a given opacity (from the transfer function) is accumulated. This is adjusted for the actual sampling distance during rendering. By default, this is the length of the diagonal of the bounding box of the volume divided by the dimensions.
- shadebool, default:
False Default off. If shading is turned on, the mapper may perform shading calculations - in some cases shading does not apply (for example, in a maximum intensity projection) and therefore shading will not be performed even if this flag is on.
- diffuse
float, default: 0.7 The diffuse lighting coefficient.
- specular
float, default: 0.2 The specular lighting coefficient.
- specular_power
float, default: 10.0 The specular power. Between
0.0and128.0.- renderbool, default:
True Force a render when True.
- user_matrix
TransformLike, default:np.eye(4) Matrix passed to the Volume class before rendering. This affects the actor/rendering only, not the input volume itself. The user matrix is the last transformation applied to the actor before rendering. Defaults to the identity matrix.
- log_scalebool, default:
False Use log scale when mapping data to colors. Scalars less than zero are mapped to the smallest representable positive float.
- **kwargs
dict,optional Optional keyword arguments.
- volume3D
- Returns:
pyvista.ActorActor of the volume.
Examples
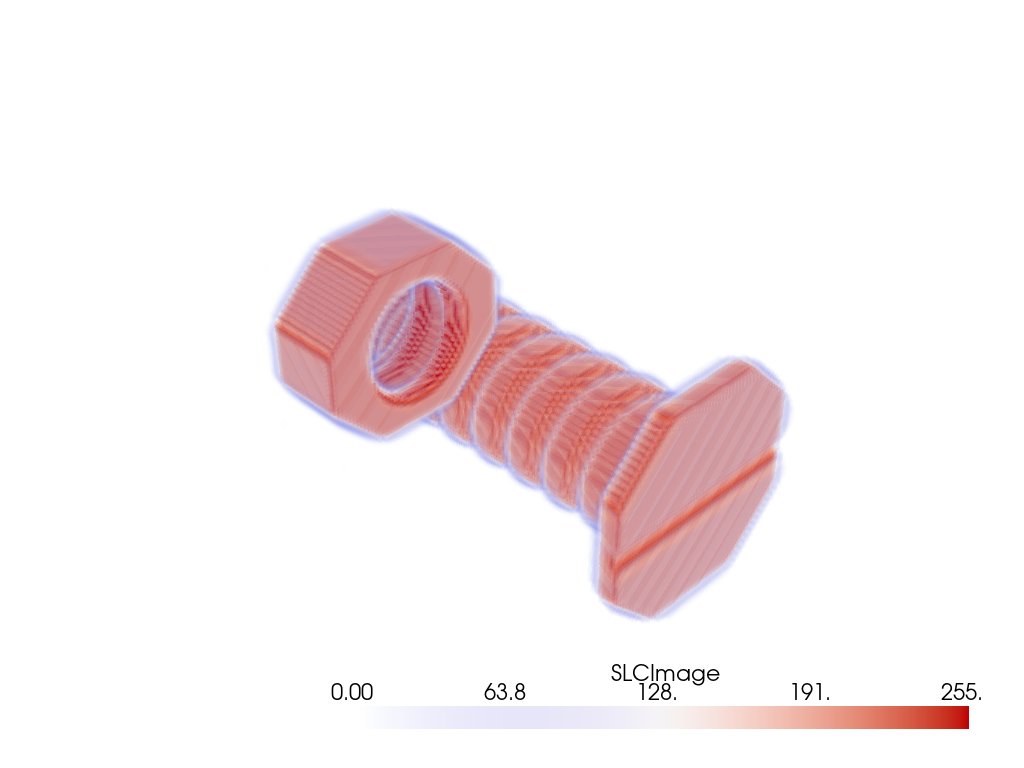
Show a built-in volume example with the coolwarm colormap.
>>> from pyvista import examples
>>> import pyvista as pv
>>> bolt_nut = examples.download_bolt_nut()
>>> pl = pv.Plotter()
>>> _ = pl.add_volume(bolt_nut, cmap='coolwarm')
>>> pl.show()
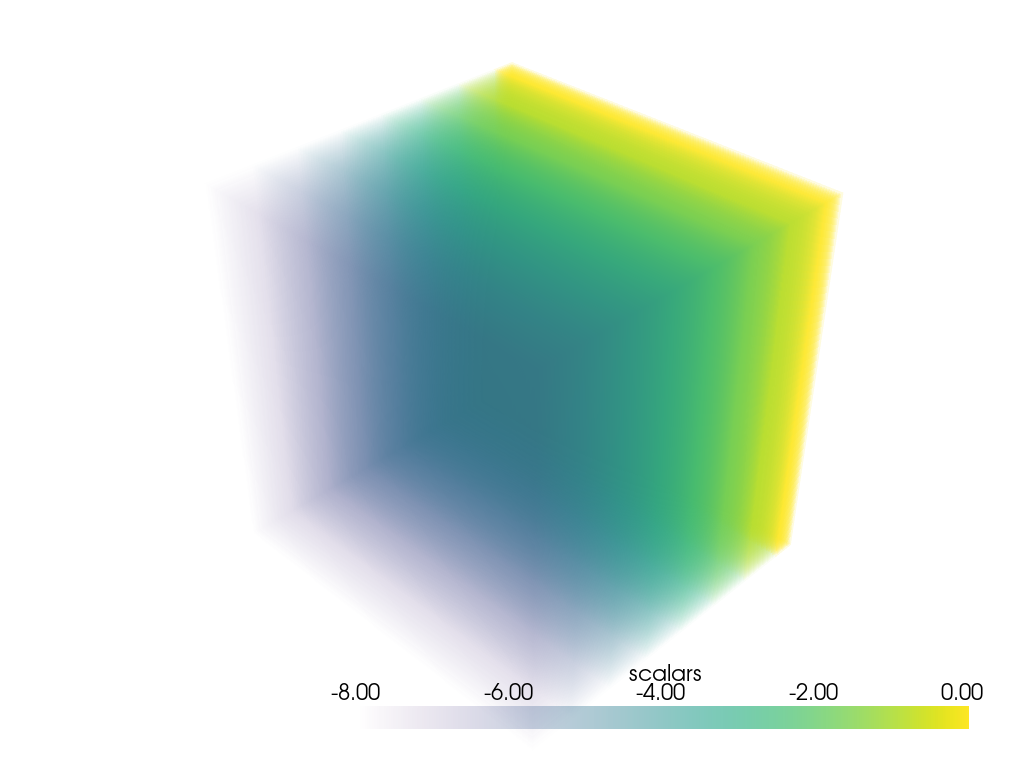
Create a volume from scratch and plot it using single vector of scalars.
>>> import pyvista as pv
>>> grid = pv.ImageData(dimensions=(9, 9, 9))
>>> grid['scalars'] = -grid.x
>>> pl = pv.Plotter()
>>> _ = pl.add_volume(grid, opacity='linear')
>>> pl.show()
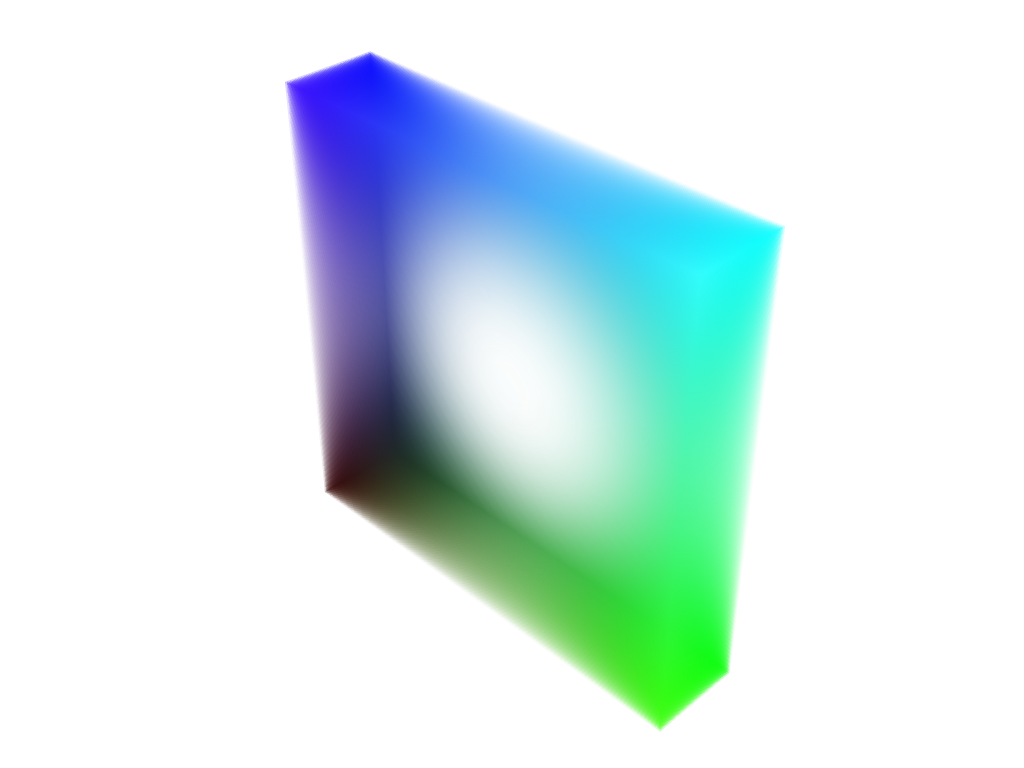
Plot a volume from scratch using RGBA scalars
>>> import pyvista as pv
>>> import numpy as np
>>> grid = pv.ImageData(dimensions=(5, 20, 20))
>>> scalars = grid.points - (grid.origin)
>>> scalars /= scalars.max()
>>> opacity = np.linalg.norm(grid.points - grid.center, axis=1).reshape(-1, 1)
>>> opacity /= opacity.max()
>>> scalars = np.hstack((scalars, opacity**3))
>>> scalars *= 255
>>> pl = pv.Plotter()
>>> vol = pl.add_volume(grid, scalars=scalars.astype(np.uint8))
>>> vol.prop.interpolation_type = 'linear'
>>> pl.show()
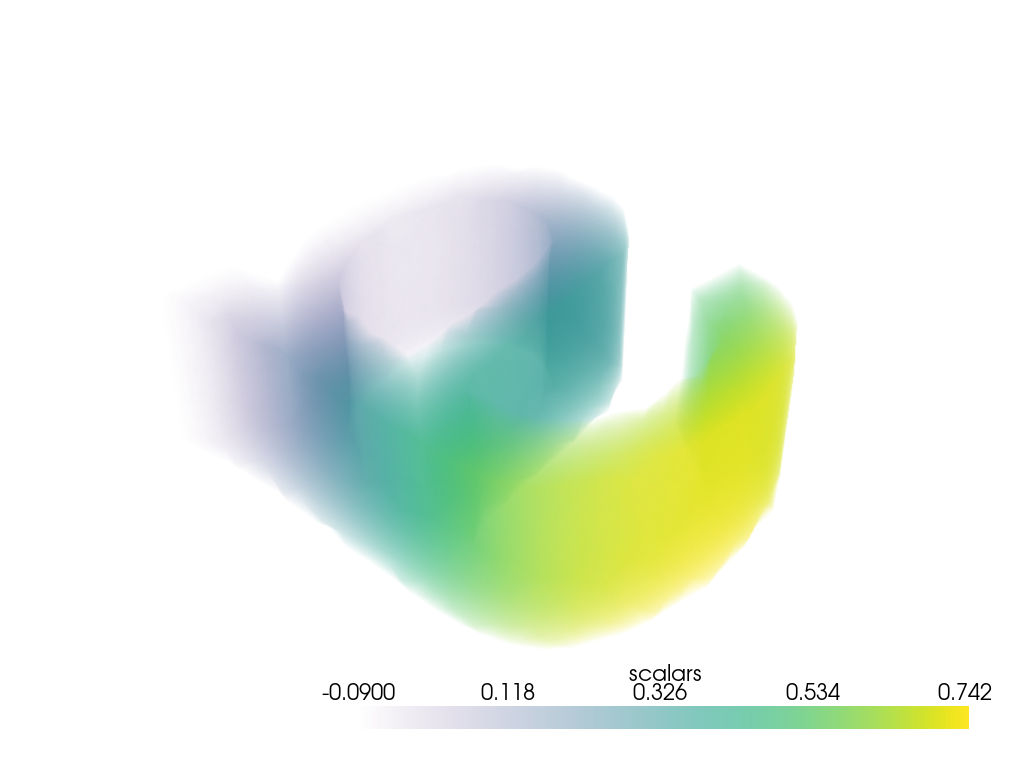
Plot an UnstructuredGrid.
>>> from pyvista import examples
>>> import pyvista as pv
>>> mesh = examples.download_letter_a()
>>> mesh['scalars'] = mesh.points[:, 1]
>>> pl = pv.Plotter()
>>> _ = pl.add_volume(mesh, opacity_unit_distance=0.1)
>>> pl.show()