Note
Go to the end to download the full example code.
Detailed Resampling#
This example uses pyvista.DataObjectFilters.sample().
pyvista.DataSetFilters.interpolate() is similar, and the two
methods are compared in Compare interpolation/sampling methods.
Resample one mesh’s point/cell arrays onto another mesh’s nodes.
This example will resample a volumetric mesh’s scalar data onto the surface of a sphere contained in that volume.
from __future__ import annotations

import pyvista as pv
from pyvista import examples
Simple Resample#
Query a grid’s points onto a sphere
mesh = pv.Sphere(center=(4.5, 4.5, 4.5), radius=4.5)
data_to_probe = examples.load_uniform()
Plot the two datasets
p = pv.Plotter()
p.add_mesh(mesh, color=True)
p.add_mesh(data_to_probe, opacity=0.5)
p.show()

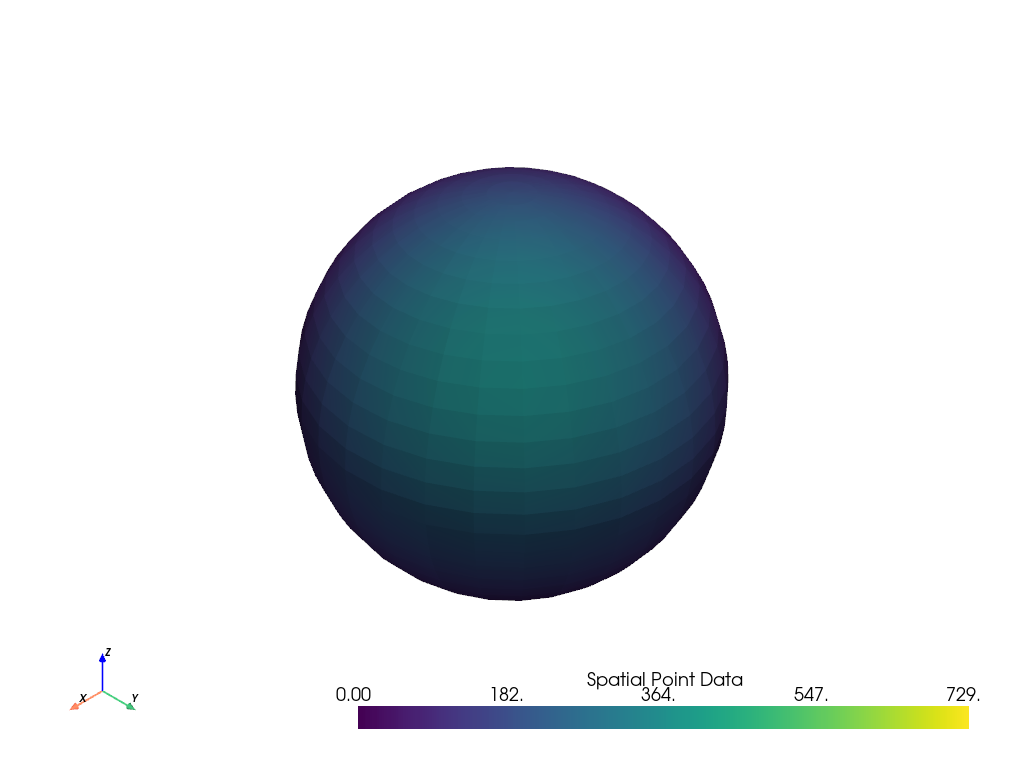
Run the algorithm and plot the result
result = mesh.sample(data_to_probe)

# Plot result
name = 'Spatial Point Data'
result.plot(scalars=name, clim=data_to_probe.get_data_range(name))
Complex Resample#
Take a volume of data and create a grid of lower resolution to resample on
data_to_probe = examples.download_embryo()
mesh = pv.create_grid(data_to_probe, dimensions=(75, 75, 75))

result = mesh.sample(data_to_probe)
threshold = lambda m: m.threshold(75.0, scalars='SLCImage')
cpos = [
    (468.9075585873713, -152.8280322856109, 152.13046602188035),
    (121.65121514580106, 140.29327609542105, 112.28137570357188),
    (-0.10881224951051659, 0.006229357618166009, 0.9940428006178236),
]
dargs = dict(clim=[0, 200], cmap='rainbow')

p = pv.Plotter(shape=(1, 2))
p.add_mesh(threshold(data_to_probe), **dargs)
p.subplot(0, 1)
p.add_mesh(threshold(result), **dargs)
p.link_views()
p.view_isometric()
p.show(cpos=cpos)

Total running time of the script: (0 minutes 6.511 seconds)