pyvista.Plotter.add_axes#
- Plotter.add_axes(
- interactive=None,
- line_width=2,
- color=None,
- x_color=None,
- y_color=None,
- z_color=None,
- xlabel='X',
- ylabel='Y',
- zlabel='Z',
- labels_off=False,
- box=None,
- box_args=None,
- viewport=(0, 0, 0.2, 0.2),
- **kwargs,
Add an interactive axes widget in the bottom left corner.
- Parameters:
- interactivebool,
optional Enable this orientation widget to be moved by the user.
- line_width
int, default: 2 The width of the marker lines.
- color
ColorLike,optional Color of the labels.
- x_color
ColorLike,optional Color used for the x-axis arrow. Defaults to theme axes parameters.
- y_color
ColorLike,optional Color used for the y-axis arrow. Defaults to theme axes parameters.
- z_color
ColorLike,optional Color used for the z-axis arrow. Defaults to theme axes parameters.
- xlabel
str, default: “X” Text used for the x-axis.
- ylabel
str, default: “Y” Text used for the y-axis.
- zlabel
str, default: “Z” Text used for the z-axis.
- labels_offbool, default:
False Enable or disable the text labels for the axes.
- boxbool,
optional Show a box orientation marker. Use
box_argsto adjust. Seepyvista.create_axes_orientation_box()for details.Deprecated since version 0.43.0: The is deprecated. Use add_box_axes method instead.
- box_args
dict,optional Parameters for the orientation box widget when
box=True. See the parameters ofpyvista.create_axes_orientation_box().- viewportsequence[
float], default: (0, 0, 0.2, 0.2) Viewport
(xstart, ystart, xend, yend)of the widget.- **kwargs
dict,optional Used for passing parameters for the orientation marker widget. See the parameters of
pyvista.create_axes_marker().
- interactivebool,
- Returns:
AxesActorAxes actor of the added widget.
See also
show_axesSimilar method which calls
add_axes()without any parameters.add_axes_at_originAdd an
pyvista.AxesActorto the origin of a scene.add_box_axesAdd an axes box as an orientation widget.
add_north_arrow_widgetAdd north arrow as an orientation widget.
add_orientation_widgetAdd any actor as an orientation widget.
- Axes Objects
Example showing different axes objects.
Examples
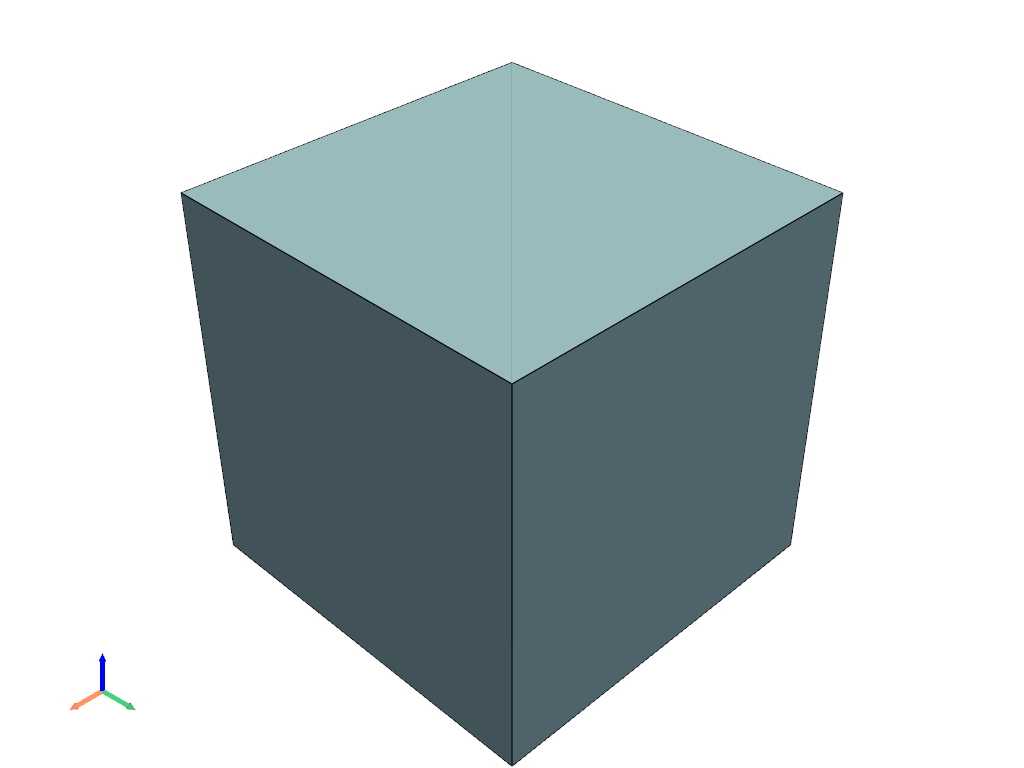
Show axes without labels and with thick lines.
>>> import pyvista as pv
>>> pl = pv.Plotter()
>>> actor = pl.add_mesh(pv.Box(), show_edges=True)
>>> _ = pl.add_axes(line_width=5, labels_off=True)
>>> pl.show()

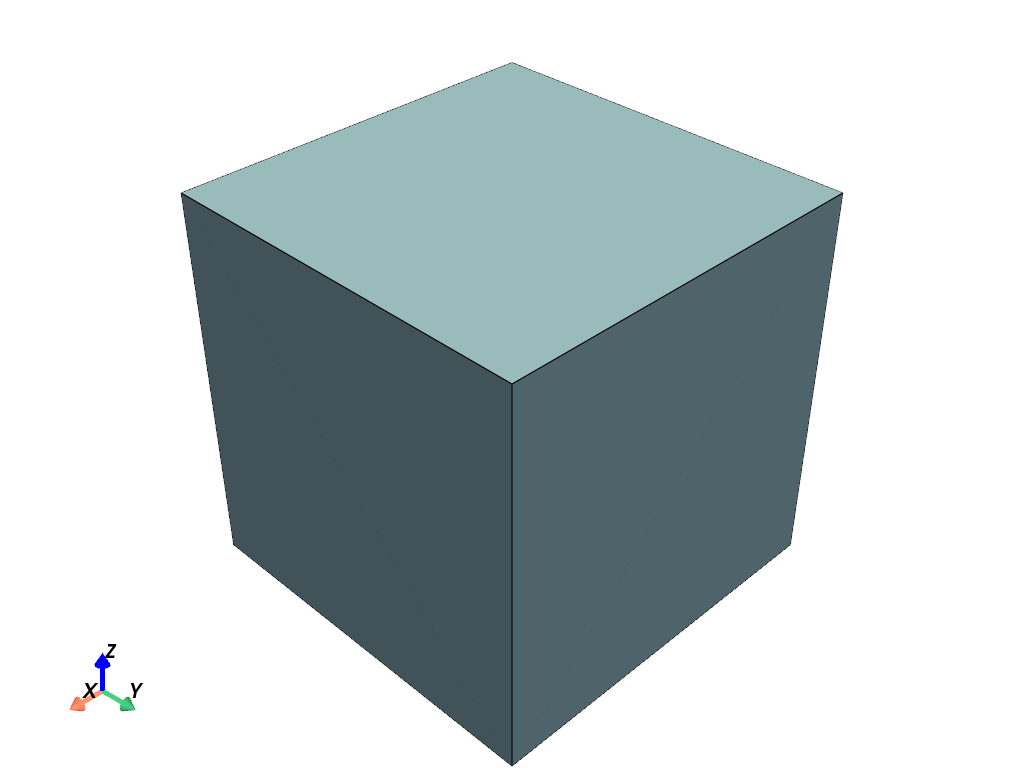
Specify more parameters for the axes marker.
>>> import pyvista as pv
>>> pl = pv.Plotter()
>>> actor = pl.add_mesh(pv.Box(), show_edges=True)
>>> _ = pl.add_axes(
...     line_width=5,
...     cone_radius=0.6,
...     shaft_length=0.7,
...     tip_length=0.3,
...     ambient=0.5,
...     label_size=(0.4, 0.16),
... )
>>> pl.show()
