DataSetFilters.extract_values#
- DataSetFilters.extract_values(
- values: float | VectorLike[float] | MatrixLike[float] | dict[str, float] | dict[float, str] | None = None,
- *,
- ranges: VectorLike[float] | MatrixLike[float] | dict[str, VectorLike[float]] | dict[tuple[float, float], str] | None = None,
- scalars: str | None = None,
- preference: Literal['point', 'cell'] = 'point',
- component_mode: Literal['any', 'all', 'multi'] | int = 'all',
- invert: bool = False,
- adjacent_cells: bool = True,
- include_cells: bool | None = None,
- split: bool = False,
- pass_point_ids: bool = True,
- pass_cell_ids: bool = True,
- progress_bar: bool = False,
Return a subset of the mesh based on the value(s) of point or cell data.
Points and cells may be extracted with a single value, multiple values, a range of values, or any mix of values and ranges. This enables threshold-like filtering of data in a discontinuous manner to extract a single label or groups of labels from categorical data, or to extract multiple regions from continuous data. Extracted values may optionally be split into separate meshes.
This filter operates on point data and cell data distinctly:
Point data
All cells with at least one point with the specified value(s) are returned. Optionally, set
adjacent_cellstoFalseto only extract points from cells where all points in the cell strictly have the specified value(s). In these cases, a point is only included in the output if that point is part of an extracted cell.Alternatively, set
include_cellstoFalseto exclude cells from the operation completely and extract all points with a specified value.Cell Data
Only the cells (and their points) with the specified values(s) are included in the output.
Internally,
extract_points()is called to extract points for point data, andextract_cells()is called to extract cells for cell data.By default, two arrays are included with the output:
'vtkOriginalPointIds'and'vtkOriginalCellIds'. These arrays can be used to link the filtered points or cells directly to the input.Added in version 0.44.
- Parameters:
- values
float|ArrayLike[float] |dict,optional Value(s) to extract. Can be a number, an iterable of numbers, or a dictionary with numeric entries. For
dictinputs, either its keys or values may be numeric, and the other field must be strings. The numeric field is used as the input for this parameter, and ifsplitisTrue, the string field is used to set the block names of the returnedMultiBlock.Note
When extracting multi-component values with
component_mode=multi, each value is specified as a multi-component scalar. In this case,valuescan be a single vector or an array of row vectors.- ranges
ArrayLike[float] |dict,optional Range(s) of values to extract. Can be a single range (i.e. a sequence of two numbers in the form
[lower, upper]), a sequence of ranges, or a dictionary with range entries. Any combination ofvaluesandrangesmay be specified together. The endpoints of the ranges are included in the extraction. Ranges cannot be set whencomponent_mode=multi.For
dictinputs, either its keys or values may be numeric, and the other field must be strings. The numeric field is used as the input for this parameter, and ifsplitisTrue, the string field is used to set the block names of the returnedMultiBlock.Note
Use
+/-infinity to specify an unlimited bound, e.g.:[0, float('inf')]to extract values greater than or equal to zero.[float('-inf'), 0]to extract values less than or equal to zero.
- scalars
str,optional Name of scalars to extract with. Defaults to currently active scalars.
- preference
str, default: ‘point’ When
scalarsis specified, this is the preferred array type to search for in the dataset. Must be either'point'or'cell'.- component_mode
int| ‘any’ | ‘all’ | ‘multi’, default: ‘all’ Specify the component(s) to use when
scalarsis a multi-component array. Has no effect when the scalars have a single component. Must be one of:number: specify the component number as a 0-indexed integer. The selected component must have the specified value(s).
'any': any single component can have the specified value(s).'all': all individual components must have the specified values(s).'multi': the entire multi-component item must have the specified value.
- invertbool, default:
False Invert the extraction values. If
Trueextract the points (with cells) which do not have the specified values.- adjacent_cellsbool, default:
True If
True, include cells (and their points) that contain at least one of the extracted points. IfFalse, only include cells that contain exclusively points from the extracted points list. Has no effect ifinclude_cellsisFalse. Has no effect when extracting values from cell data.- include_cellsbool, default:
None Specify if cells shall be used for extraction or not. If
False, points with the specified values are extracted regardless of their cell connectivity, and all cells at the output will be vertex cells (one for each point.) Has no effect when extracting values from cell data.By default, this value is
Trueif the input has at least one cell andFalseotherwise.- splitbool, default:
False If
True, each value invaluesand each range inrangeis extracted independently and returned as aMultiBlock. The number of blocks returned equals the number of input values and ranges. The blocks may be named if a dictionary is used as input. Seevaluesandrangesfor details.Note
Output blocks may contain empty meshes if no values meet the extraction criteria. This can impact plotting since empty meshes cannot be plotted by default. Use
pyvista.MultiBlock.clean()on the output to remove empty meshes, or setpv.global_theme.allow_empty_mesh = Trueto enable plotting empty meshes.- pass_point_idsbool, default:
True Add a point array
'vtkOriginalPointIds'that identifies the original points the extracted points correspond to.- pass_cell_idsbool, default:
True Add a cell array
'vtkOriginalCellIds'that identifies the original cells the extracted cells correspond to.- progress_barbool, default:
False Display a progress bar to indicate progress.
- values
- Returns:
- output
pyvista.UnstructuredGrid|pyvista.MultiBlock An extracted mesh or a composite of extracted meshes, depending on
split.
- output
See also
split_valuesWrapper around this filter to split values and return a
MultiBlock.select_values()Similar filter specialized for
ImageData.extract_pointsExtract a subset of a mesh’s points.
extract_cellsExtract a subset of a mesh’s cells.
thresholdSimilar filter for thresholding a mesh by value.
partitionSplit a mesh into a number of sub-parts.
- Compare threshold filters
This example showcases this filter and other similar ones.
Examples
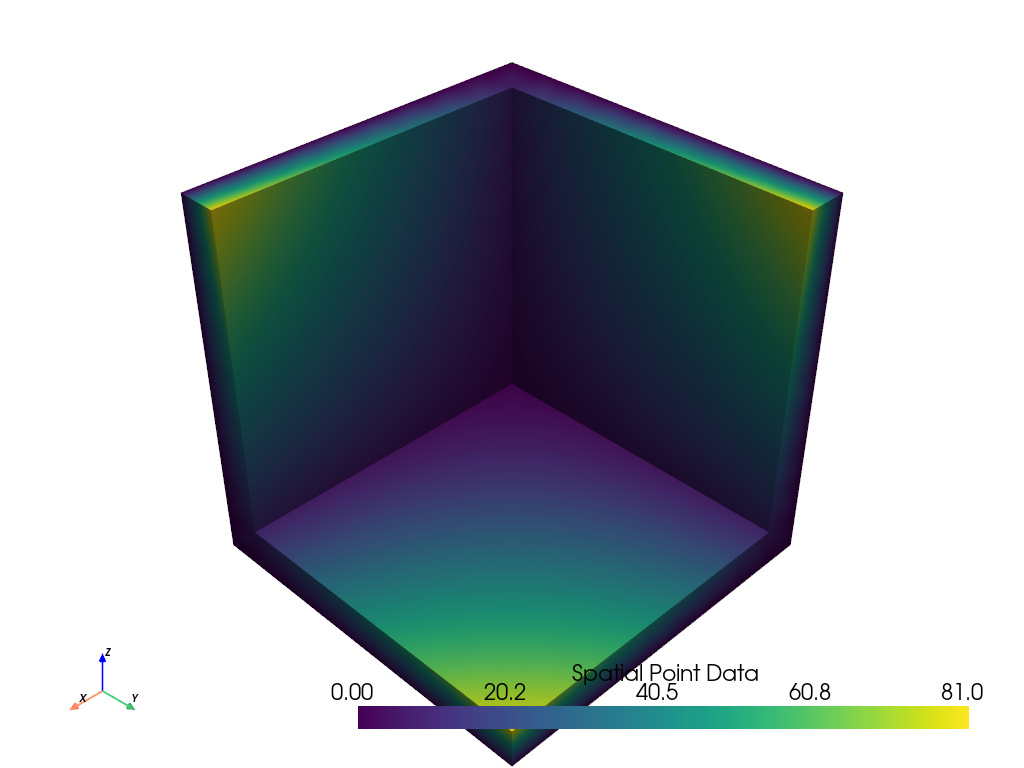
Extract a single value from a grid’s point data.
>>> import numpy as np
>>> import pyvista as pv
>>> from pyvista import examples
>>> mesh = examples.load_uniform()
>>> extracted = mesh.extract_values(0)
Plot extracted values. Since adjacent cells are included by default, points with values other than
0are included in the output.>>> extracted.get_data_range() (np.float64(0.0), np.float64(81.0)) >>> extracted.plot()
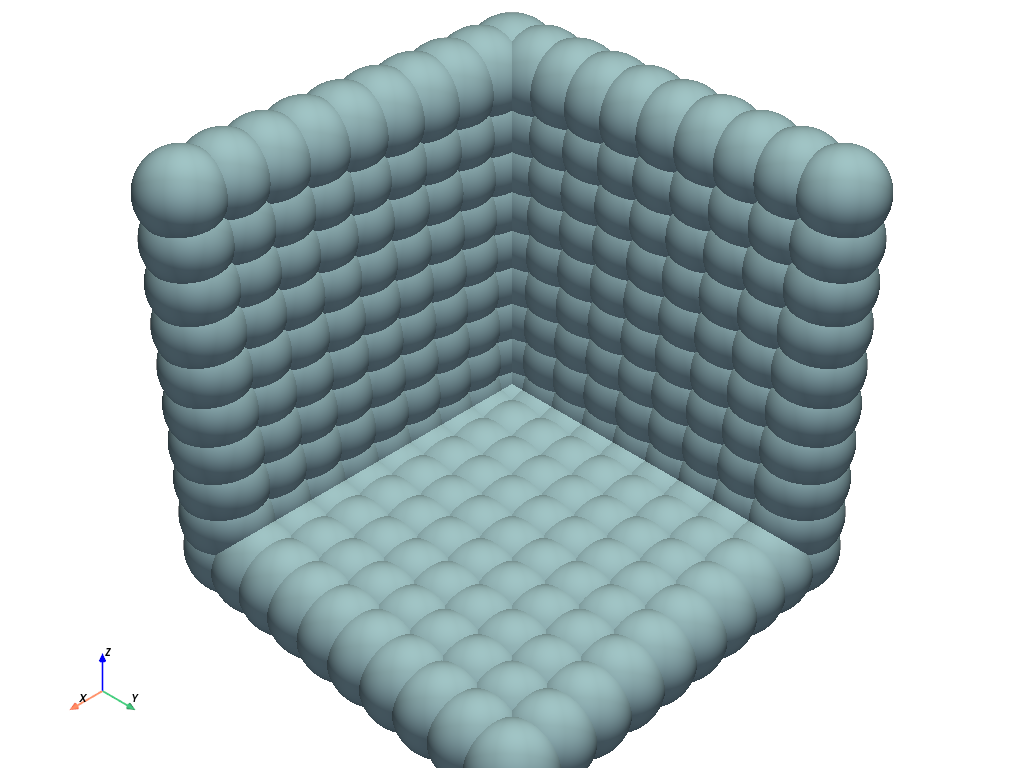
Set
include_cells=Falseto only extract points. The output scalars now strictly contain zeros.>>> extracted = mesh.extract_values(0, include_cells=False) >>> extracted.get_data_range() (np.float64(0.0), np.float64(0.0)) >>> extracted.plot(render_points_as_spheres=True, point_size=100, color=True)
Use
rangesto extract values from a grid’s point data in range.Here, we use
+/-infinity to extract all values of100or less.>>> extracted = mesh.extract_values(ranges=[-np.inf, 100]) >>> extracted.plot()
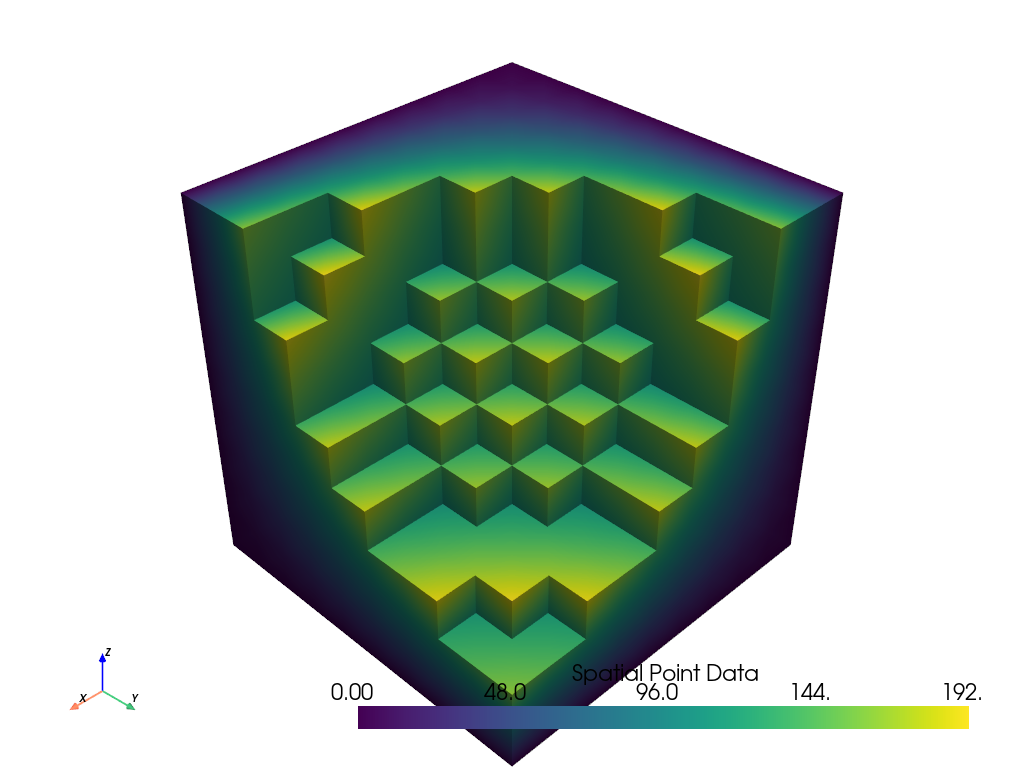
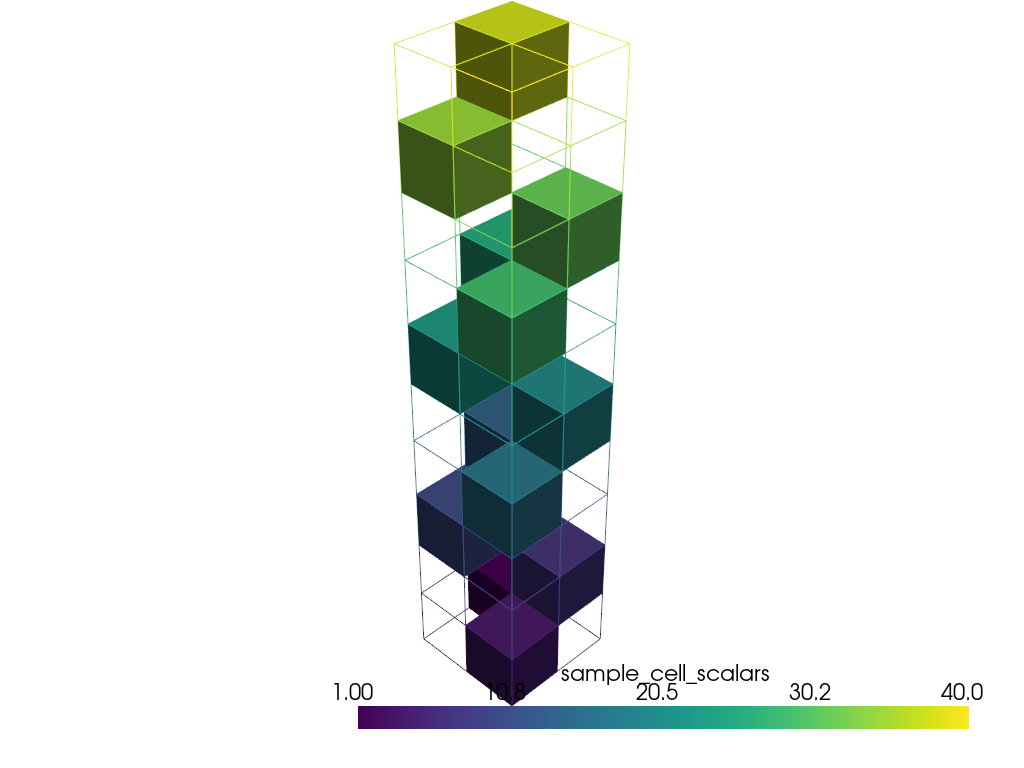
Extract every third cell value from cell data.
>>> mesh = examples.load_hexbeam()
>>> lower, upper = mesh.get_data_range()
>>> step = 3
>>> extracted = mesh.extract_values(
...     range(lower, upper, step)  # values 0, 3, 6, ...
... )
Plot result and show an outline of the input for context.
>>> pl = pv.Plotter()
>>> _ = pl.add_mesh(extracted)
>>> _ = pl.add_mesh(mesh.extract_all_edges())
>>> pl.show()
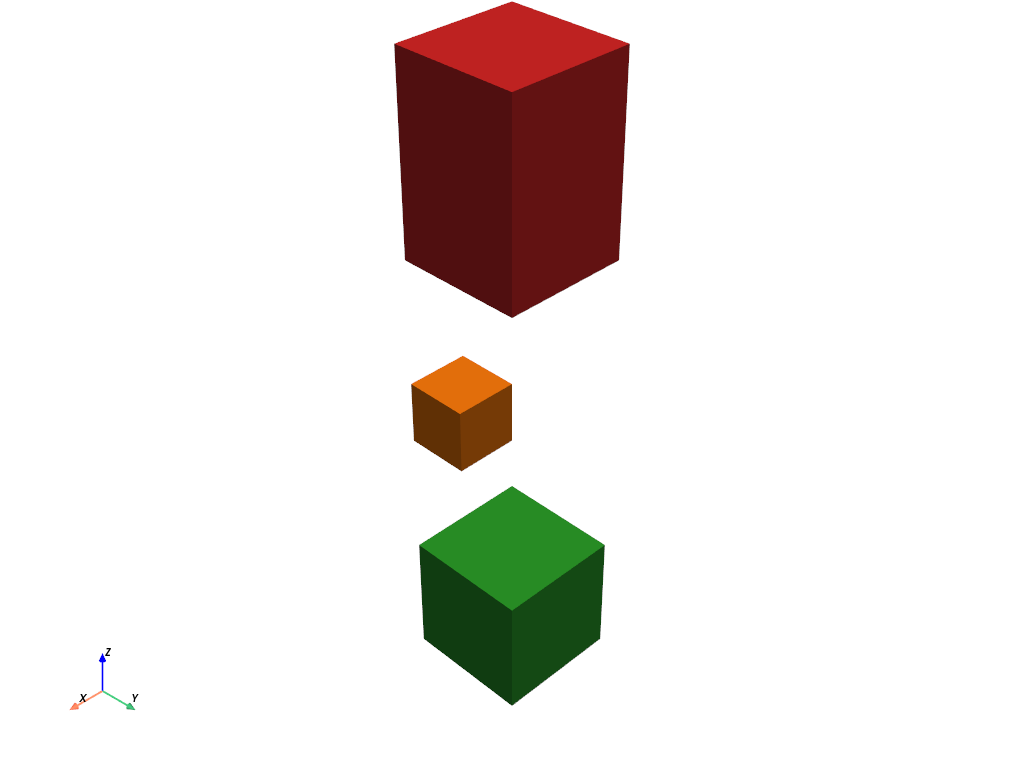
Any combination of values and ranges may be specified.
E.g. extract a single value and two ranges, and split the result into separate blocks of a MultiBlock.
>>> extracted = mesh.extract_values(
...     values=18, ranges=[[0, 8], [29, 40]], split=True
... )
>>> extracted
MultiBlock (...)
  N Blocks:   3
  X Bounds:   0.000e+00, 1.000e+00
  Y Bounds:   0.000e+00, 1.000e+00
  Z Bounds:   0.000e+00, 5.000e+00
>>> extracted.plot(multi_colors=True)
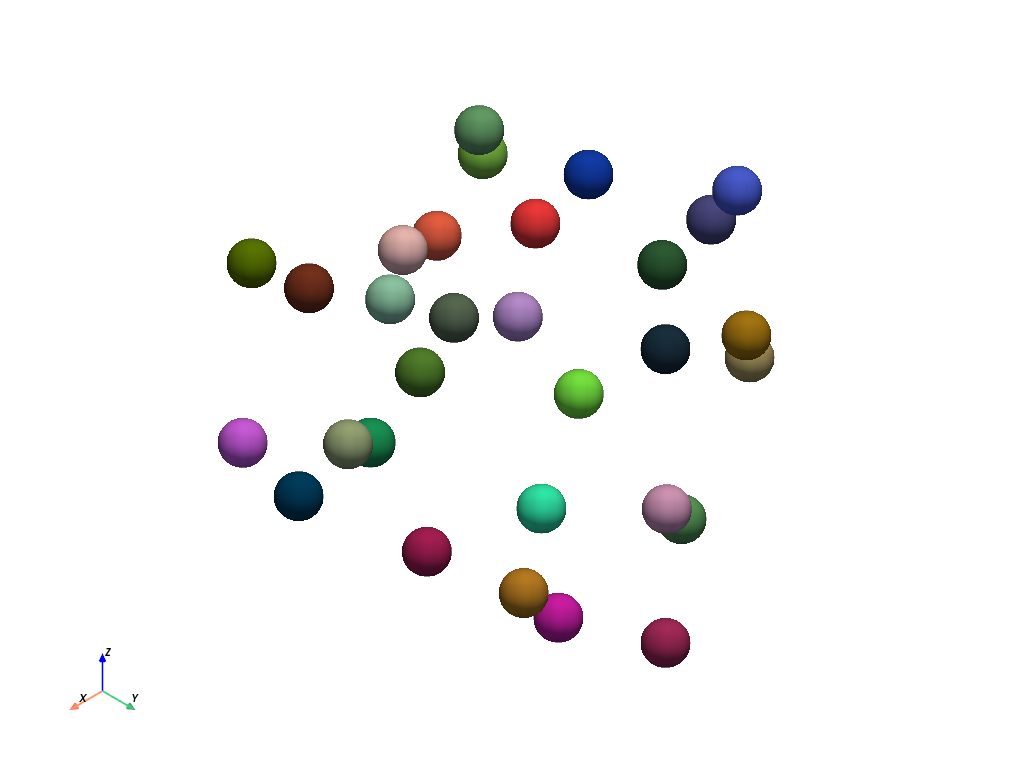
Extract values from multi-component scalars.
First, create a point cloud with a 3-component RGB color array.
>>> rng = np.random.default_rng(seed=1)
>>> points = rng.random((30, 3))
>>> colors = rng.random((30, 3))
>>> point_cloud = pv.PointSet(points)
>>> point_cloud['colors'] = colors
>>> plot_kwargs = dict(render_points_as_spheres=True, point_size=50, rgb=True)
>>> point_cloud.plot(**plot_kwargs)
Extract values from a single component.
E.g. extract points with a strong red component (i.e. > 0.8).
>>> extracted = point_cloud.extract_values(ranges=[0.8, 1.0], component_mode=0)
>>> extracted.plot(**plot_kwargs)
Extract values from all components.
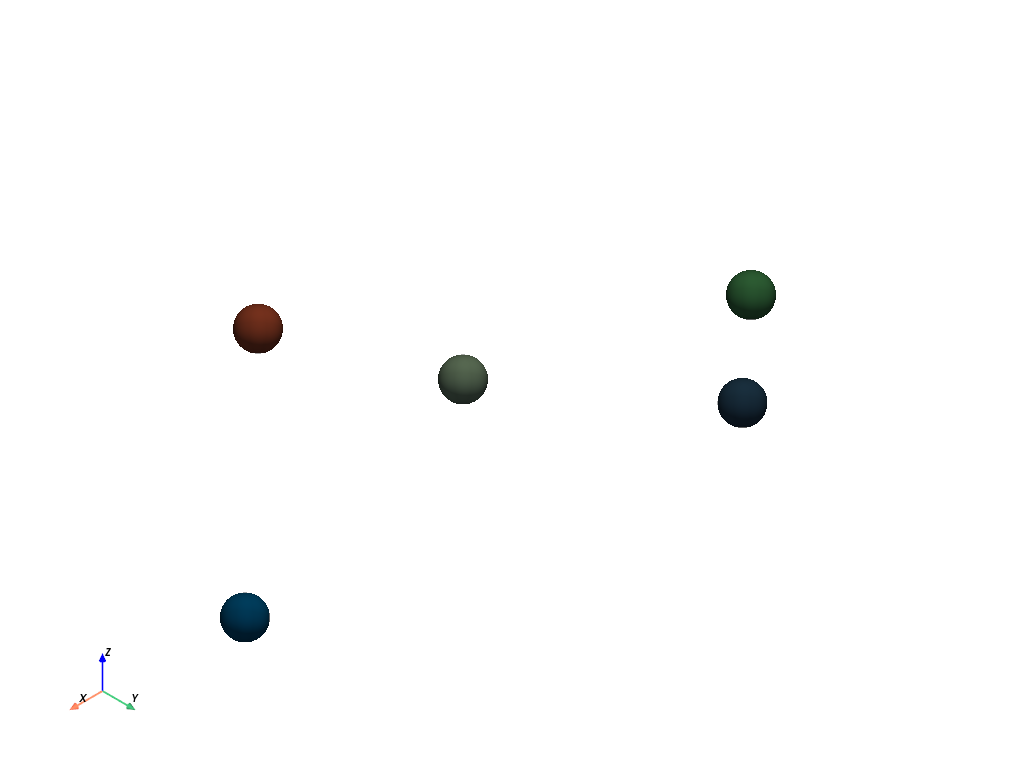
E.g. extract points where all RGB components are dark (i.e. < 0.5).
>>> extracted = point_cloud.extract_values(
...     ranges=[0.0, 0.5], component_mode='all'
... )
>>> extracted.plot(**plot_kwargs)
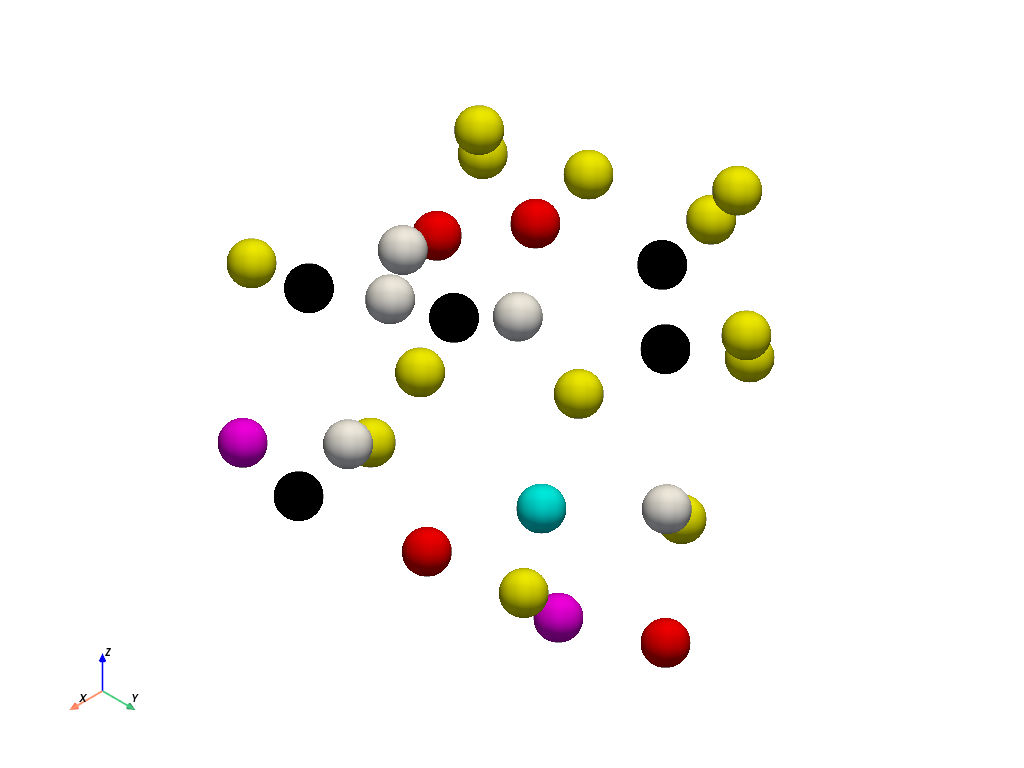
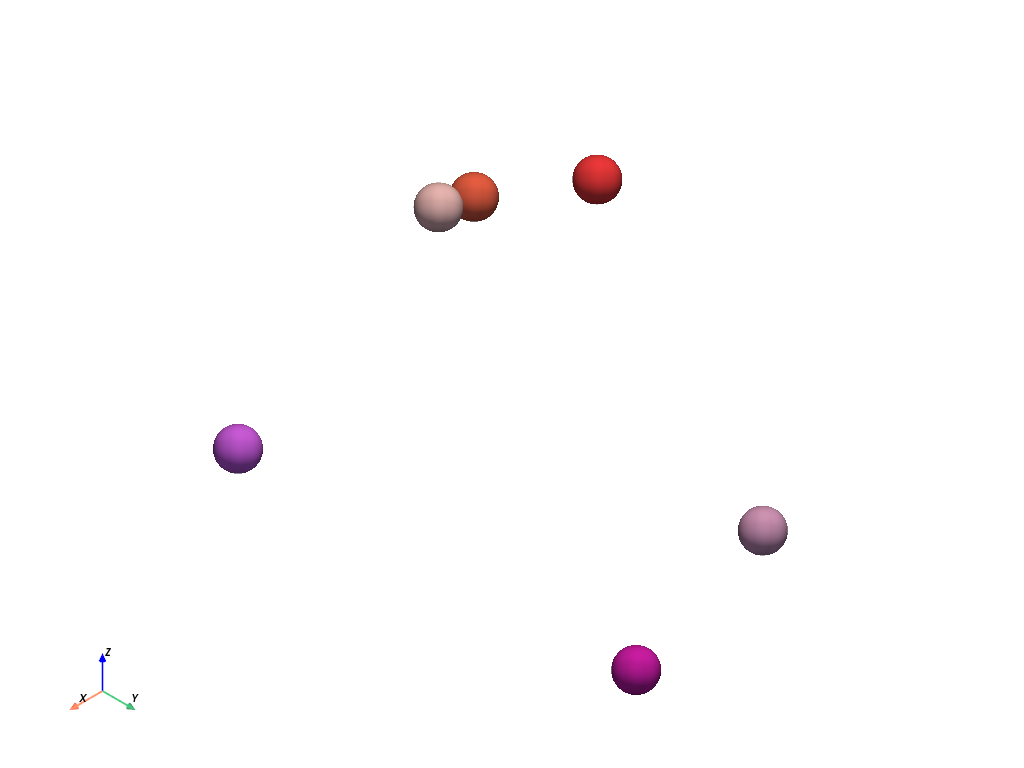
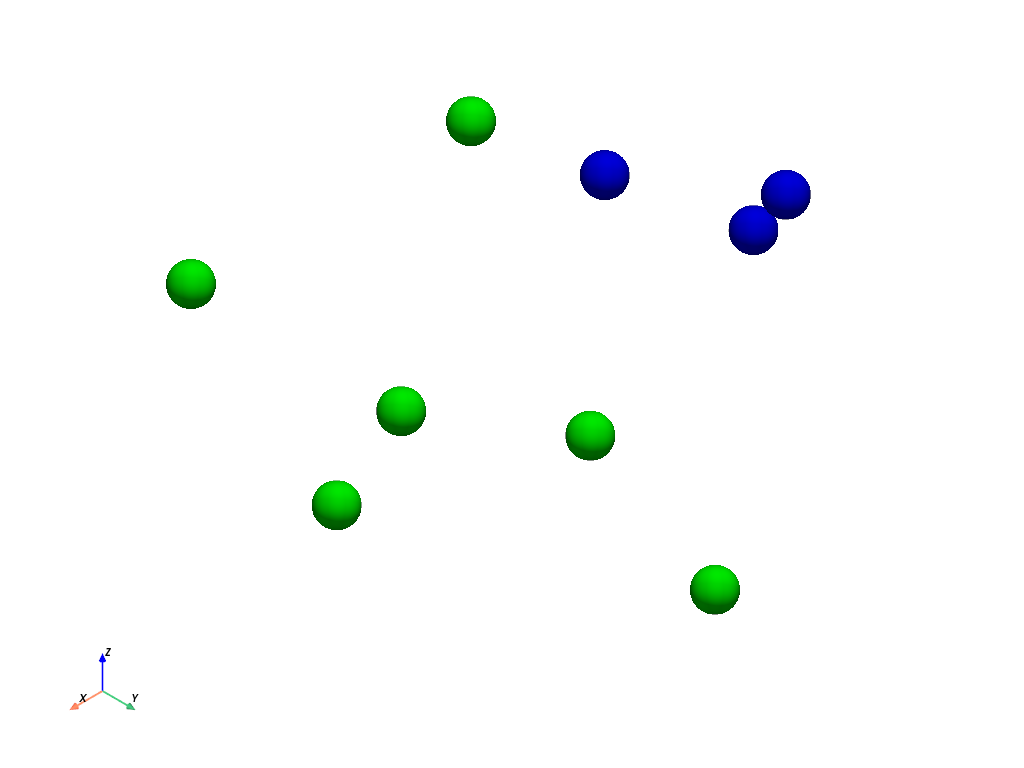
Extract specific multi-component values.
E.g. round the scalars to create binary RGB components, and extract only green and blue components.
>>> point_cloud['colors'] = np.round(point_cloud['colors'])
>>> green = [0, 1, 0]
>>> blue = [0, 0, 1]
>>>
>>> extracted = point_cloud.extract_values(
...     values=[blue, green],
...     component_mode='multi',
... )
>>> extracted.plot(**plot_kwargs)
Use the original IDs returned by the extraction to modify the original point cloud.
For example, change the color of the blue and green points to yellow.
>>> point_ids = extracted['vtkOriginalPointIds']
>>> yellow = [1, 1, 0]
>>> point_cloud['colors'][point_ids] = yellow
>>> point_cloud.plot(**plot_kwargs)