pyvista.ImageDataFilters.select_values#
- ImageDataFilters.select_values(
- values: float | VectorLike[float] | MatrixLike[float] | dict[str, float] | dict[float, str] | None = None,
- *,
- ranges: VectorLike[float] | MatrixLike[float] | dict[str, VectorLike[float]] | dict[tuple[float, float], str] | None = None,
- fill_value: float | VectorLike[float] = 0,
- replacement_value: float | VectorLike[float] | None = None,
- scalars: str | None = None,
- preference: Literal['point', 'cell'] = 'point',
- component_mode: Literal['any', 'all', 'multi'] | int = 'all',
- invert: bool = False,
- split: bool = False,
Select values of interest and fill the rest with a constant.
Point or cell data may be selected with a single value, multiple values, a range of values, or any mix of values and ranges. This enables threshold-like filtering of data in a discontinuous manner to select a single label or groups of labels from categorical data, or to select multiple regions from continuous data. Selected values may optionally be split into separate meshes.
The selected values are stored in an array with the same name as the input.
Added in version 0.45.
- Parameters:
- values
float|ArrayLike[float] |dict,optional Value(s) to select. Can be a number, an iterable of numbers, or a dictionary with numeric entries. For
dictinputs, either its keys or values may be numeric, and the other field must be strings. The numeric field is used as the input for this parameter, and ifsplitisTrue, the string field is used to set the block names of the returnedMultiBlock.Note
When selecting multi-component values with
component_mode=multi, each value is specified as a multi-component scalar. In this case,valuescan be a single vector or an array of row vectors.- ranges
ArrayLike[float] |dict,optional Range(s) of values to select. Can be a single range (i.e. a sequence of two numbers in the form
[lower, upper]), a sequence of ranges, or a dictionary with range entries. Any combination ofvaluesandrangesmay be specified together. The endpoints of the ranges are included in the selection. Ranges cannot be set whencomponent_mode=multi.For
dictinputs, either its keys or values may be numeric, and the other field must be strings. The numeric field is used as the input for this parameter, and ifsplitisTrue, the string field is used to set the block names of the returnedMultiBlock.Note
Use
+/-infinity to specify an unlimited bound, e.g.:[0, float('inf')]to select values greater than or equal to zero.[float('-inf'), 0]to select values less than or equal to zero.
- fill_value
float|VectorLike[float], default: 0 Value used to fill the image. Can be a single value or a multi-component vector. Non-selected parts of the image will have this value.
- replacement_value
float|VectorLike[float],optional Replacement value for the output array. Can be a single value or a multi-component vector. If provided, selected values will be replaced with the given value. If no value is given, the selected values are retained and returned as-is. Setting this value is useful for generating a binarized output array.
- scalars
str,optional Name of scalars to select from. Defaults to currently active scalars.
- preference
str, default: ‘point’ When
scalarsis specified, this is the preferred array type to search for in the dataset. Must be either'point'or'cell'.- component_mode
int| ‘any’ | ‘all’ | ‘multi’, default: ‘all’ Specify the component(s) to use when
scalarsis a multi-component array. Has no effect when the scalars have a single component. Must be one of:number: specify the component number as a 0-indexed integer. The selected component must have the specified value(s).
'any': any single component can have the specified value(s).'all': all individual components must have the specified values(s).'multi': the entire multi-component item must have the specified value.
- invertbool, default:
False Invert the selection. If
Truevalues are selected which do not have the specified values.- splitbool, default:
False If
True, each value invaluesand each range inrangeis selected independently and returned as aMultiBlock. The number of blocks returned equals the number of input values and ranges. The blocks may be named if a dictionary is used as input. Seevaluesandrangesfor details.Note
Output blocks may contain meshes with only the
fill_valueif no values meet the selection criteria.
- values
- Returns:
pyvista.ImageDataorpyvista.MultiBlockImage with selected values or a composite of meshes with selected values, depending on
split.
See also
image_thresholdSimilar filter for thresholding
ImageData.extract_values()Similar threshold-like filter for extracting values from any dataset.
split_values()Split a mesh by value into separate meshes.
threshold()Generalized thresholding filter which returns a
UnstructuredGrid.
Examples
Load a CT image. Here we load
download_whole_body_ct_male().>>> import pyvista as pv >>> from pyvista import examples >>> dataset = examples.download_whole_body_ct_male() >>> ct_image = dataset['ct']
Show the initial data range.
>>> ct_image.get_data_range()
(np.int16(-1348), np.int16(3409))
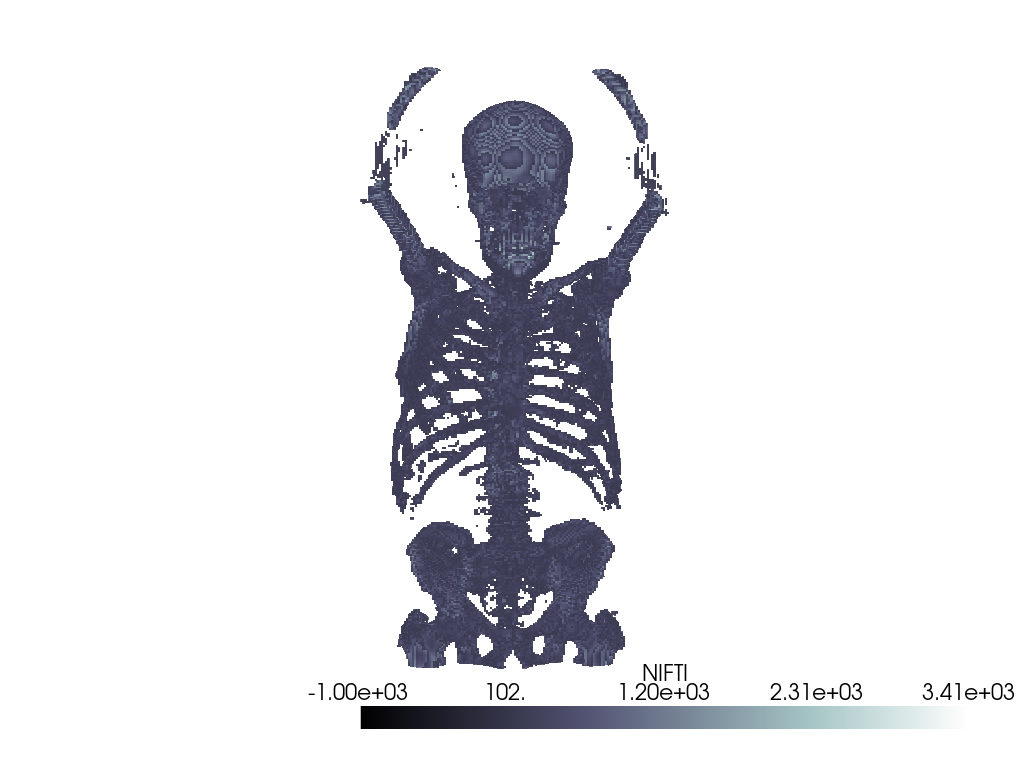
Select intensity values above
150to select the bones.>>> bone_range = [150, float('inf')] >>> fill_value = -1000 # fill with intensity values corresponding to air >>> bone_image = ct_image.select_values( ... ranges=bone_range, fill_value=fill_value ... )
Show the new data range.
>>> bone_image.get_data_range()
(np.int16(-1000), np.int16(3409))
Plot the selected values. Use
'foreground'opacity to make the fill value transparent and the selected values opaque.>>> pl = pv.Plotter() >>> _ = pl.add_volume( ... bone_image, ... opacity='foreground', ... cmap='bone', ... ) >>> pl.view_zx() >>> pl.camera.up = (0, 0, 1) >>> pl.show()
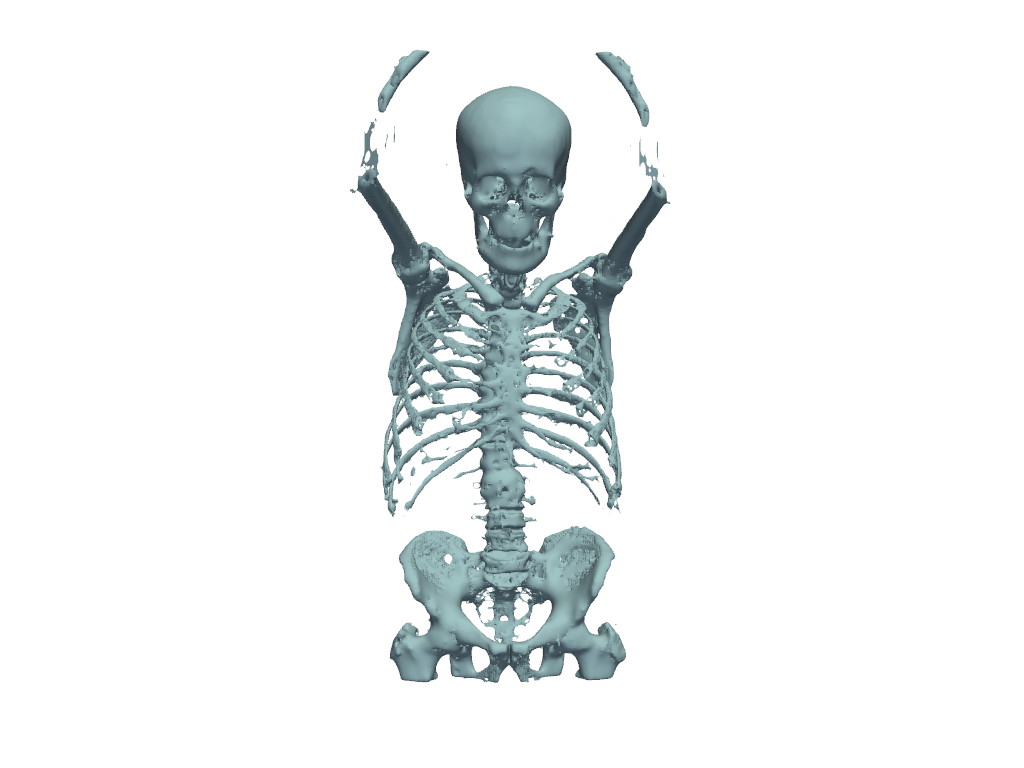
Use
'replacement_value'to binarize the selected values instead. The fill value, or background, is0by default.>>> bone_mask = ct_image.select_values(ranges=bone_range, replacement_value=1) >>> bone_mask.get_data_range() (np.int16(0), np.int16(1))
Generate a surface contour of the mask and plot it.
>>> surf = bone_mask.contour_labels()
>>> pl = pv.Plotter()
>>> _ = pl.add_mesh(surf, color=True)
>>> pl.view_zx()
>>> pl.camera.up = (0, 0, 1)
>>> pl.show()
Load a color image. Here we load
download_beach().>>> image = examples.download_beach() >>> plot_kwargs = dict( ... cpos='xy', rgb=True, lighting=False, zoom='tight', show_axes=False ... ) >>> image.plot(**plot_kwargs)

Select components from the image which have a strong red component. Use
replacement_valueto replace these pixels with a pure red color andfill_valueto fill the rest of the image with white pixels.>>> white = [255, 255, 255] >>> red = [255, 0, 0] >>> red_range = [200, 255] >>> red_component = 0 >>> selected = image.select_values( ... ranges=red_range, ... component_mode=red_component, ... replacement_value=red, ... fill_value=white, ... )
>>> selected.plot(**plot_kwargs)