pyvista.DataSetFilters.split_values#
- DataSetFilters.split_values(
- values: None | float | VectorLike[float] | MatrixLike[float] | dict[str, float] | dict[float, str] = None,
- *,
- ranges: None | VectorLike[float] | MatrixLike[float] | dict[str, VectorLike[float]] | dict[tuple[float, float], str] = None,
- scalars: str | None = None,
- preference: Literal['point', 'cell'] = 'point',
- component_mode: Literal['any', 'all', 'multi'] | int = 'all',
- **kwargs,
Split mesh into separate sub-meshes using point or cell data.
By default, this filter generates a separate mesh for each unique value in the data array and combines them as blocks in a
MultiBlockdataset. Optionally, specific values and/or ranges of values may be specified to control which values to split from the input.This filter is a convenience method for
extract_values()withsplitset toTrueby default. Refer to that filter’s documentation for more details.Added in version 0.44.
- Parameters:
- values
float|ArrayLike[float] |dict,optional Value(s) to extract. Can be a number, an iterable of numbers, or a dictionary with numeric entries. For
dictinputs, either its keys or values may be numeric, and the other field must be strings. The numeric field is used as the input for this parameter, and ifsplitisTrue, the string field is used to set the block names of the returnedMultiBlock.Note
When extracting multi-component values with
component_mode=multi, each value is specified as a multi-component scalar. In this case,valuescan be a single vector or an array of row vectors.- rangesarray_like |
dict,optional Range(s) of values to extract. Can be a single range (i.e. a sequence of two numbers in the form
[lower, upper]), a sequence of ranges, or a dictionary with range entries. Any combination ofvaluesandrangesmay be specified together. The endpoints of the ranges are included in the extraction. Ranges cannot be set whencomponent_mode=multi.For
dictinputs, either its keys or values may be numeric, and the other field must be strings. The numeric field is used as the input for this parameter, and ifsplitisTrue, the string field is used to set the block names of the returnedMultiBlock.Note
Use
+/-infinity to specify an unlimited bound, e.g.:[0, float('inf')]to extract values greater than or equal to zero.[float('-inf'), 0]to extract values less than or equal to zero.
- scalars
str,optional Name of scalars to extract with. Defaults to currently active scalars.
- preference
str, default: ‘point’ When
scalarsis specified, this is the preferred array type to search for in the dataset. Must be either'point'or'cell'.- component_mode
int| ‘any’ | ‘all’ | ‘multi’, default: ‘all’ Specify the component(s) to use when
scalarsis a multi-component array. Has no effect when the scalars have a single component. Must be one of:number: specify the component number as a 0-indexed integer. The selected component must have the specified value(s).
'any': any single component can have the specified value(s).'all': all individual components must have the specified values(s).'multi': the entire multi-component item must have the specified value.
- **kwargs
dict,optional Additional keyword arguments passed to
extract_values().
- values
- Returns:
pyvista.MultiBlockComposite of split meshes with
pyvista.UnstructuredGridblocks.
See also
Examples
Load image with labeled regions.
>>> import numpy as np
>>> import pyvista as pv
>>> from pyvista import examples
>>> image = examples.load_channels()
>>> np.unique(image.active_scalars)
pyvista_ndarray([0, 1, 2, 3, 4])
Split the image into its separate regions. Here, we also remove the first region for visualization.
>>> multiblock = image.split_values()
>>> _ = multiblock.pop(0)  # Remove first region
Plot the regions.
>>> pl = pv.Plotter()
>>> _ = pl.add_composite(multiblock, multi_colors=True)
>>> _ = pl.show_grid()
>>> pl.show()
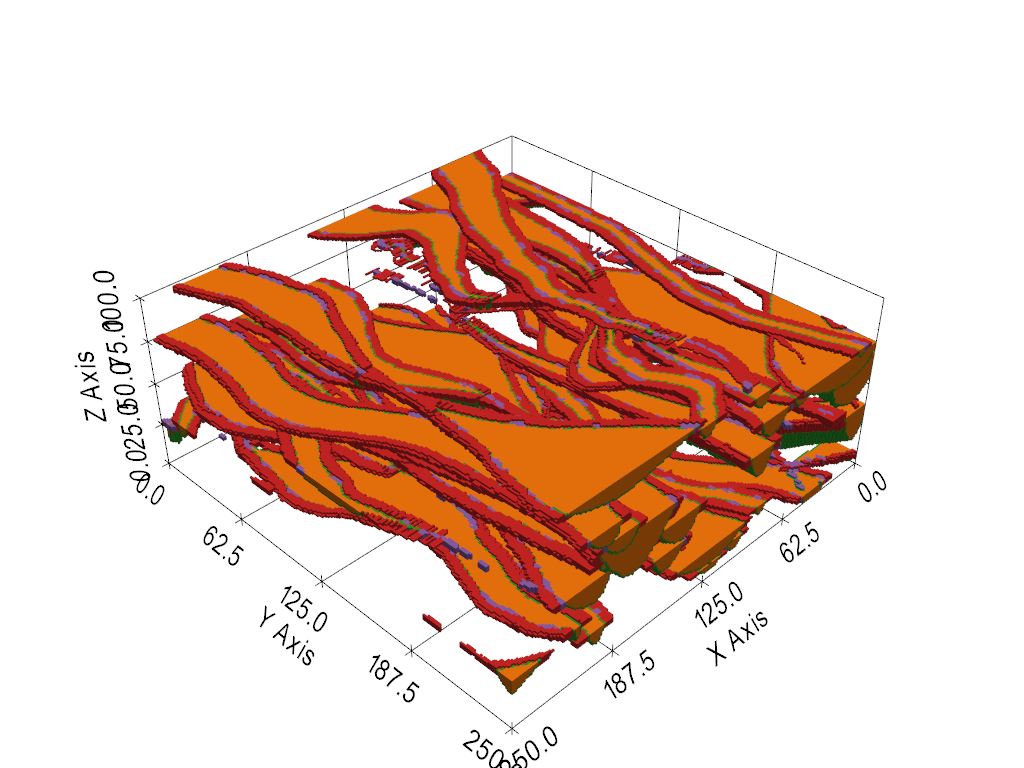
Note that the block names are generic by default.
>>> multiblock.keys()
['Block-01', 'Block-02', 'Block-03', 'Block-04']
To name the output blocks, use a dictionary as input instead.
Here, we also explicitly omit the region with
0values from the input instead of removing it from the output.>>> labels = dict(region1=1, region2=2, region3=3, region4=4) >>> >>> multiblock = image.split_values(labels) >>> multiblock.keys() ['region1', 'region2', 'region3', 'region4']
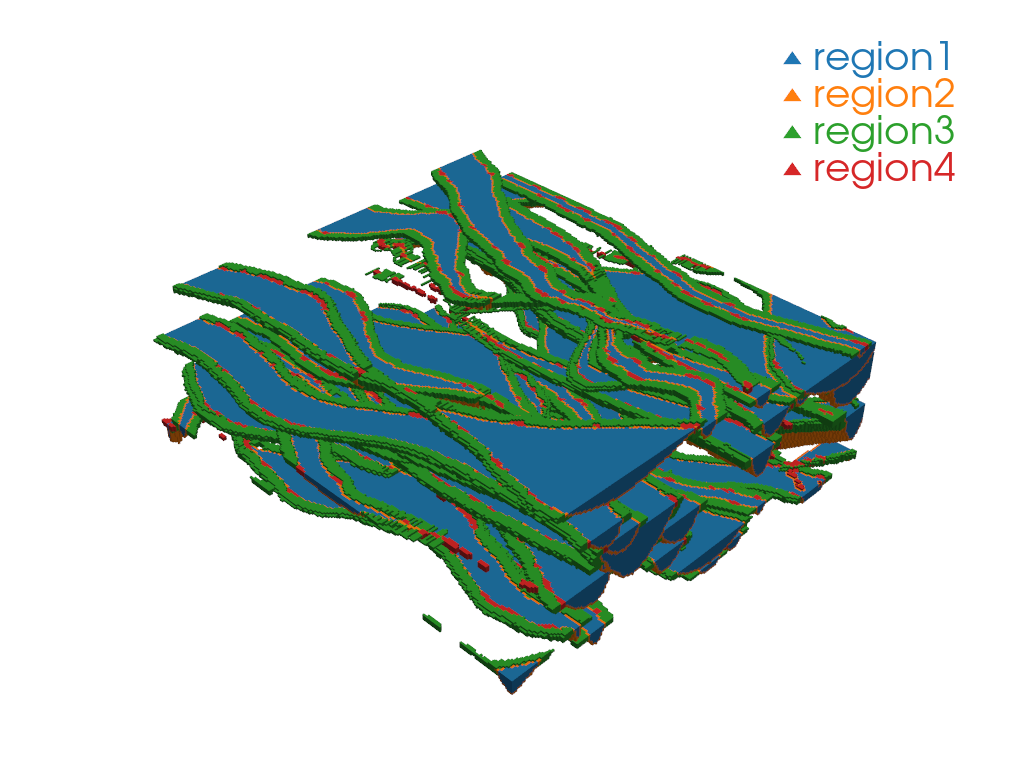
Plot the regions as separate meshes using the labels instead of plotting the MultiBlock directly.
Clear scalar data so we can color each mesh using a single color
>>> _ = [block.clear_data() for block in multiblock]
>>>
>>> pl = pv.Plotter()
>>> pl.set_color_cycler('default')
>>> _ = [
...     pl.add_mesh(block, label=label)
...     for block, label in zip(multiblock, labels)
... ]
>>> _ = pl.add_legend()
>>> pl.show()