DataSetFilters.voxelize_rectilinear#
- DataSetFilters.voxelize_rectilinear(
- *,
- background_value: int | float = 0,
- foreground_value: int | float = 1,
- reference_volume: ImageData | None = None,
- dimensions: VectorLike[int] | None = None,
- spacing: float | VectorLike[float] | None = None,
- rounding_func: Callable[[VectorLike[float]], VectorLike[int]] | None = None,
- cell_length_percentile: float | None = None,
- cell_length_sample_size: int | None = None,
- progress_bar: bool = False,
Voxelize mesh to create a RectilinearGrid voxel volume.
The voxelization can be controlled in several ways:
Specify the output geometry using a
reference_volume.Specify the
spacingexplicitly.Specify the
dimensionsexplicitly.Specify the
cell_length_percentile. The spacing is estimated from the surface’s cells using the specified percentile.
Use
reference_volumefor full control of the output grid’s geometry. For all other options, the geometry is implicitly defined such that the generated grid fits the bounds of the input mesh.If no inputs are provided,
cell_length_percentile=0.1(tenth percentile) is used by default to estimate the spacing.A point data array
maskis included where points inside and outside of the input surface are labelled withforeground_valueandbackground_value, respectively.Added in version 0.46.
Note
This method is a wrapper around
voxelize_binary_mask(). See that method for additional information.- Parameters:
- background_value
int, default: 0 Background value of the generated grid.
- foreground_value
int, default: 1 Foreground value of the generated grid.
- reference_volume
ImageData,optional Volume to use as a reference. The output will have the same
dimensions,origin,spacing,offset, anddirection_matrixas the reference.- dimensions
VectorLike[int],optional Dimensions of the generated rectilinear grid. Set this value to control the dimensions explicitly. If unset, the dimensions are defined implicitly through other parameter. See summary and examples for details.
Note
Dimensions is the number of points along each axis, not cells. Set dimensions to
N+1instead forNcells along each axis.- spacing
float|VectorLike[float],optional Approximate spacing to use for the generated grid. Set this value to control the spacing explicitly. If unset, the spacing is defined implicitly through other parameters. See summary and examples for details.
- rounding_func
Callable[VectorLike[float],VectorLike[int]],optional Control how the dimensions are rounded to integers based on the provided or calculated
spacing. Should accept a length-3 vector containing the dimension values along the three directions and return a length-3 vector.numpy.round()is used by default.Rounding the dimensions implies rounding the actual spacing.
Has no effect if
reference_volumeordimensionsare specified.- cell_length_percentile
float,optional Cell length percentage
pto use for computing the defaultspacing. Default is0.1(tenth percentile) and must be between0and1. Thep-th percentile is computed from the cumulative distribution function (CDF) of lengths which are representative of the cell length scales present in the input. The CDF is computed by:Triangulating the input cells.
Sampling a subset of up to
cell_length_sample_sizecells.Computing the distance between two random points in each cell.
Inserting the distance into an ordered set to create the CDF.
Has no effect if
dimensionsorreference_volumeare specified.- cell_length_sample_size
int,optional Number of samples to use for the cumulative distribution function (CDF) when using the
cell_length_percentileoption.100 000samples are used by default.- progress_barbool, default:
False Display a progress bar to indicate progress.
- background_value
- Returns:
RectilinearGridRectilinearGrid as voxelized volume with discretized cells.
Examples#
Download Python source code | Download Jupyter notebook
Create a voxel volume of a nut. By default, the spacing is automatically estimated.
>>> import pyvista as pv
>>> from pyvista import examples
>>> mesh = pv.examples.load_nut()
>>> vox = mesh.voxelize_rectilinear()
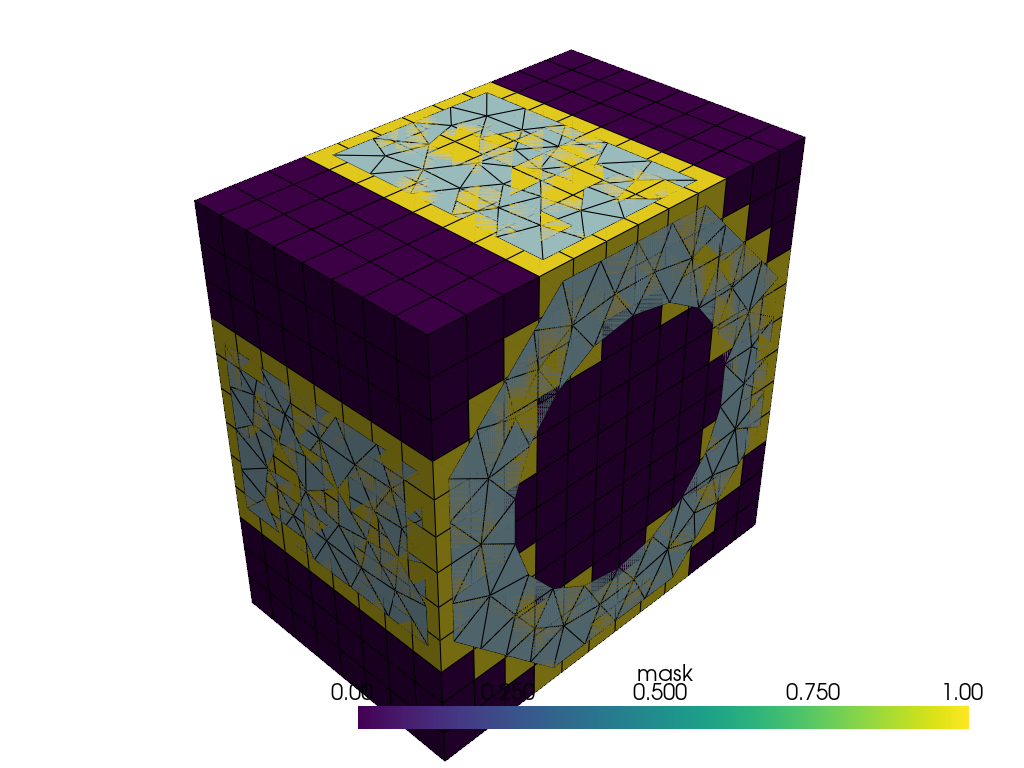
Plot the mesh together with its volume.
>>> pl = pv.Plotter()
>>> _ = pl.add_mesh(mesh=vox, show_edges=True)
>>> _ = pl.add_mesh(mesh=mesh, show_edges=True, opacity=1)
>>> pl.show()
Load a mesh of a cow.
>>> mesh = examples.download_cow()
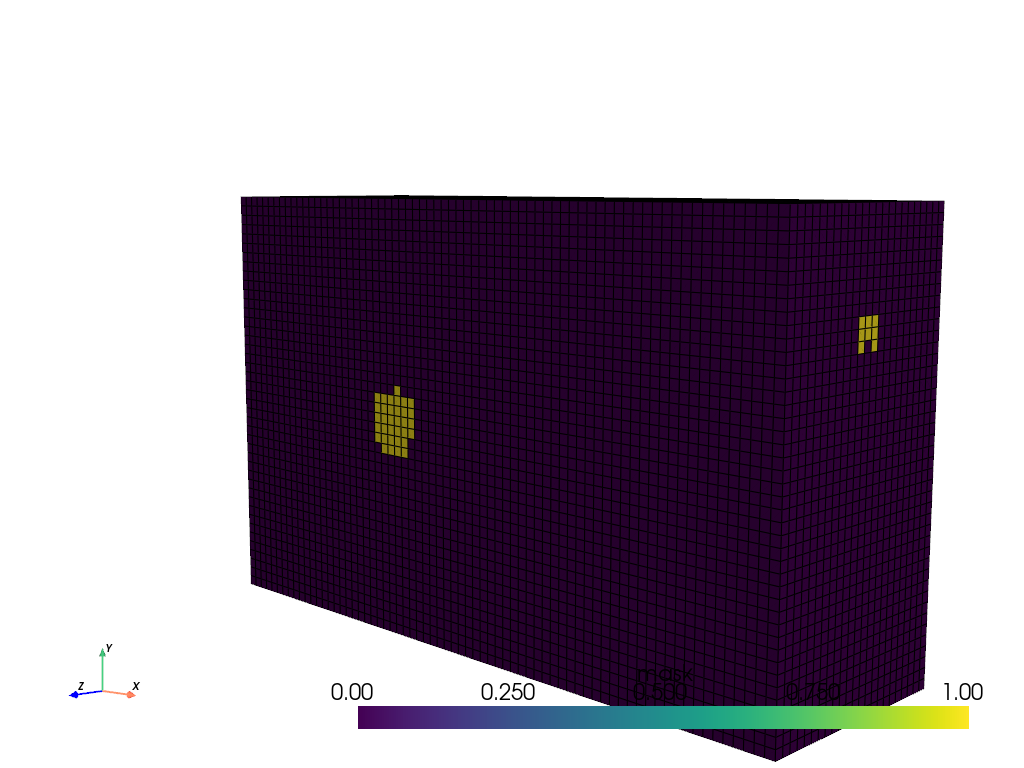
Create an equal density voxel volume and plot the result.
>>> vox = mesh.voxelize_rectilinear(spacing=0.15)
>>> cpos = pv.CameraPosition(
...     position=(15, 3, 15), focal_point=(0, 0, 0), viewup=(0, 1, 0)
... )
>>> vox.plot(scalars='mask', show_edges=True, cpos=cpos)
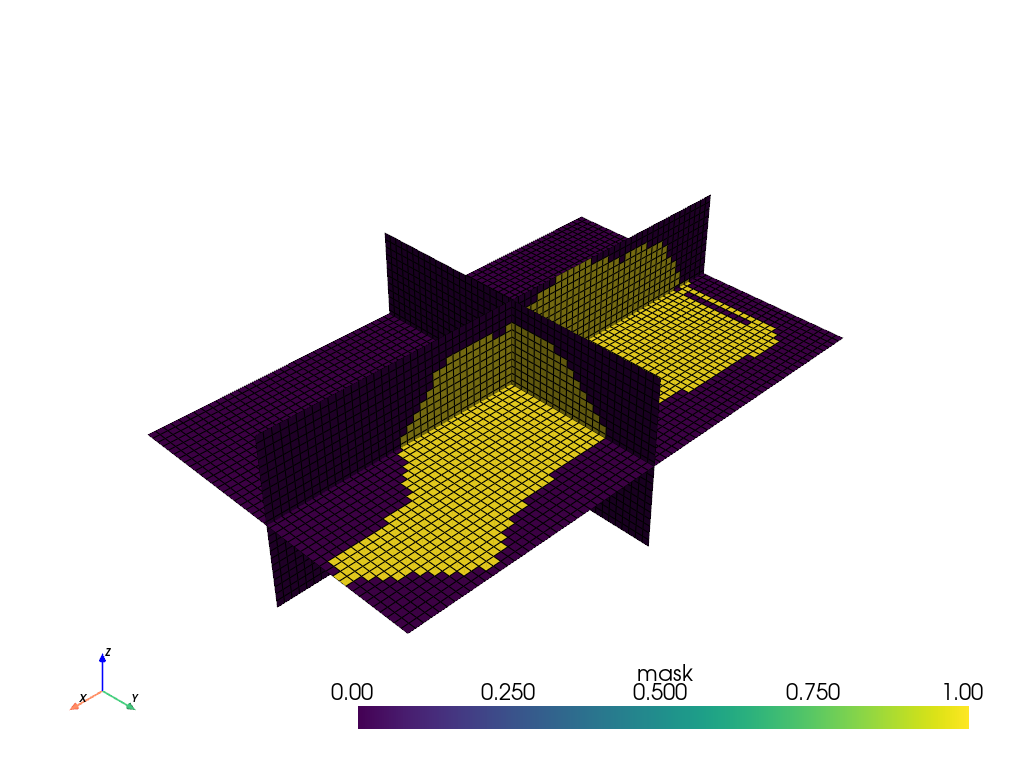
Slice the voxel volume to view the mask scalars.
>>> slices = vox.slice_orthogonal()
>>> slices.plot(scalars='mask', show_edges=True)
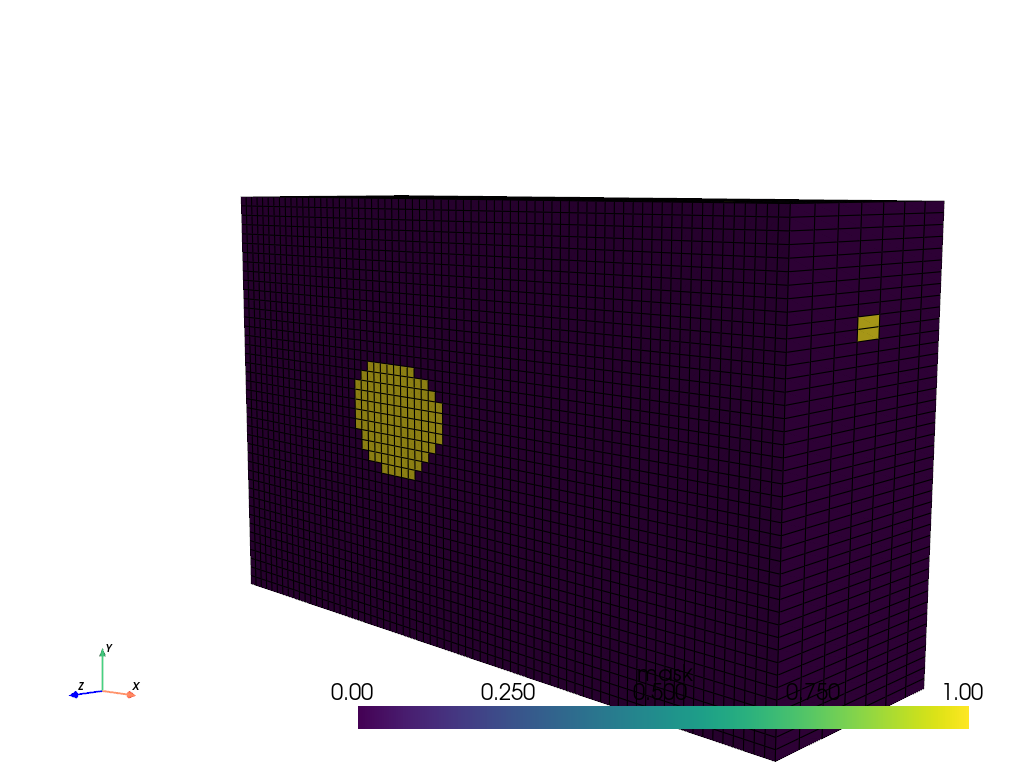
Create a voxel volume from unequal density dimensions and plot result.
>>> vox = mesh.voxelize_rectilinear(spacing=(0.15, 0.15, 0.5))
>>> vox.plot(scalars='mask', show_edges=True, cpos=cpos)
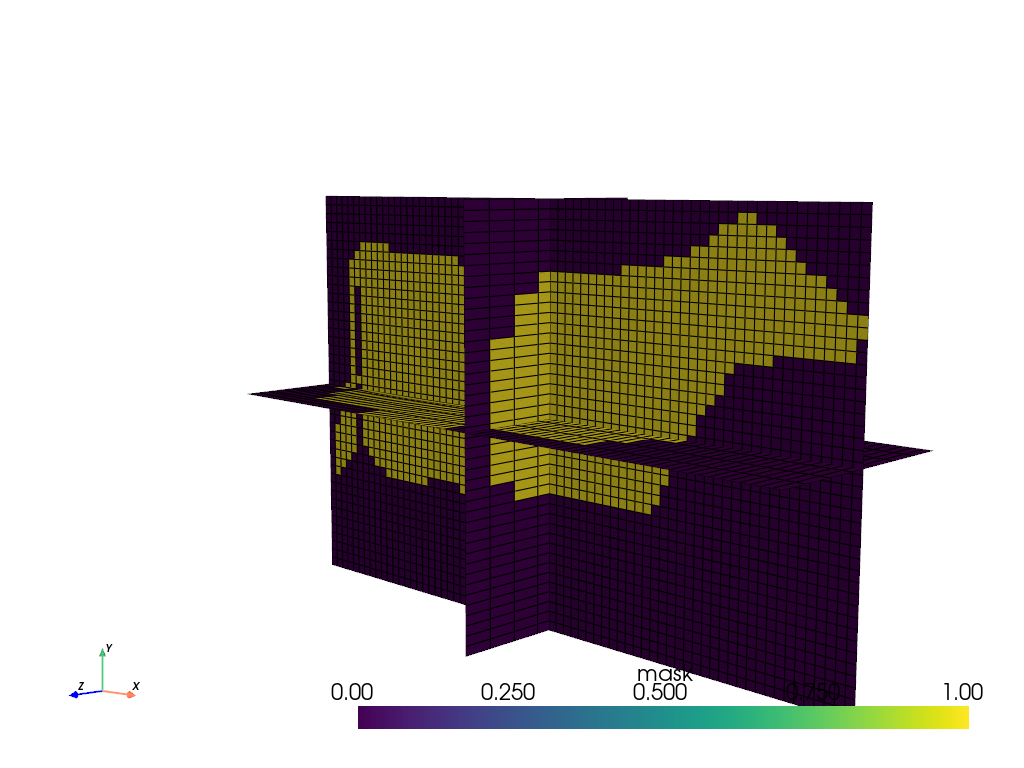
Slice the unequal density voxel volume to view the mask scalars.
>>> slices = vox.slice_orthogonal()
>>> slices.plot(scalars='mask', show_edges=True, cpos=cpos)
See Also#
voxelizeSimilar function that returns a
UnstructuredGridofVOXELcells.voxelize_binary_maskSimilar function that returns a
ImageDatawith point data.
