pyvista.plotting.charts.BoxPlot.stats#
- property BoxPlot.stats[ソース]#
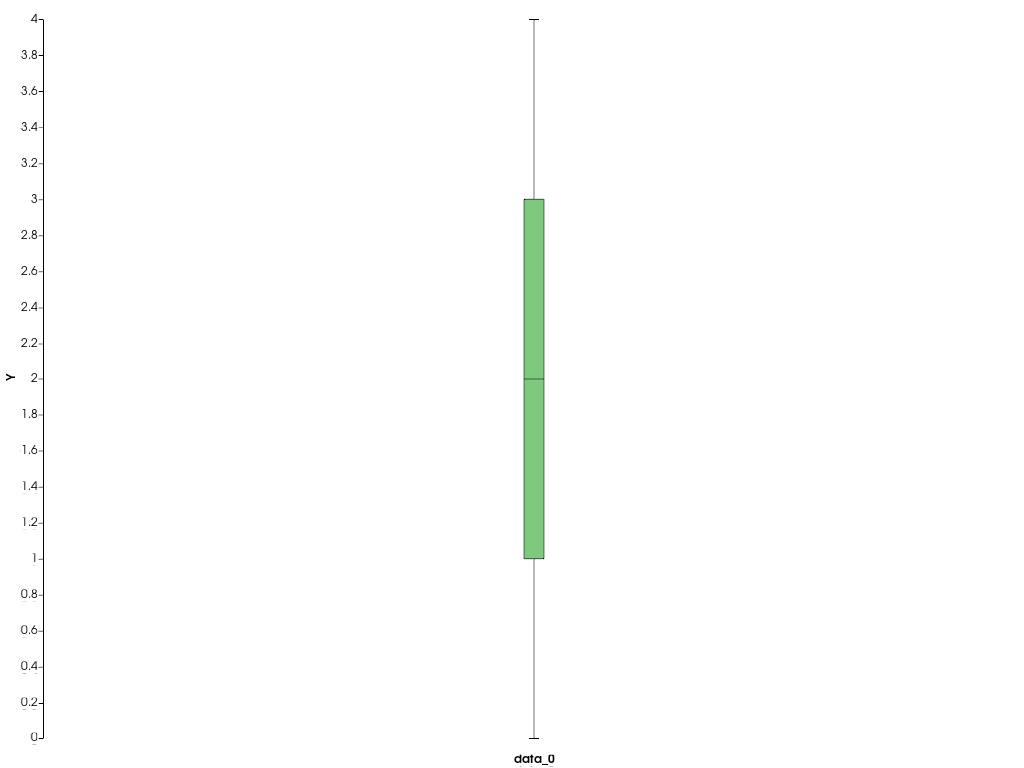
Retrieve the statistics of the datasets of which the boxplots are drawn.
The statistics are the quartiles and extremum values.
例
箱ひげ図を作成し,統計データを作成します.
>>> import pyvista as pv
>>> chart = pv.ChartBox([[0, 1, 1, 2, 3, 3, 4]])
>>> chart.plot.stats
(pyvista_ndarray([0., 1., 2., 3., 4.]),)
>>> chart.show()