注釈
Go to the end をクリックすると完全なサンプルコードをダウンロードできます.
スプラインの作成#
pyvista.Spline() を使用してXYZ頂点の数の多い配列からスプライン/ポリラインを作成します
from __future__ import annotations

import numpy as np

import pyvista as pv
プロットするデータセットを作成する
def make_points():
    """Make XYZ points."""
    theta = np.linspace(-4 * np.pi, 4 * np.pi, 100)
    z = np.linspace(-2, 2, 100)
    r = z**2 + 1
    x = r * np.sin(theta)
    y = r * np.cos(theta)
    return np.column_stack((x, y, z))


points = make_points()
points[0:5, :]
array([[ 2.44929360e-15,  5.00000000e+00, -2.00000000e+00],
       [ 1.21556036e+00,  4.68488752e+00, -1.95959596e+00],
       [ 2.27700402e+00,  4.09249671e+00, -1.91919192e+00],
       [ 3.12595020e+00,  3.27840221e+00, -1.87878788e+00],
       [ 3.72150434e+00,  2.30906573e+00, -1.83838384e+00]])
ここで, pyvista.PolyData メッシュ上にラインセルを作成できる関数を作成しましょう.
def lines_from_points(points):
    """Given an array of points, make a line set."""
    poly = pv.PolyData()
    poly.points = points
    cells = np.full((len(points) - 1, 3), 2, dtype=np.int_)
    cells[:, 1] = np.arange(0, len(points) - 1, dtype=np.int_)
    cells[:, 2] = np.arange(1, len(points), dtype=np.int_)
    poly.lines = cells
    return poly


line = lines_from_points(points)
line

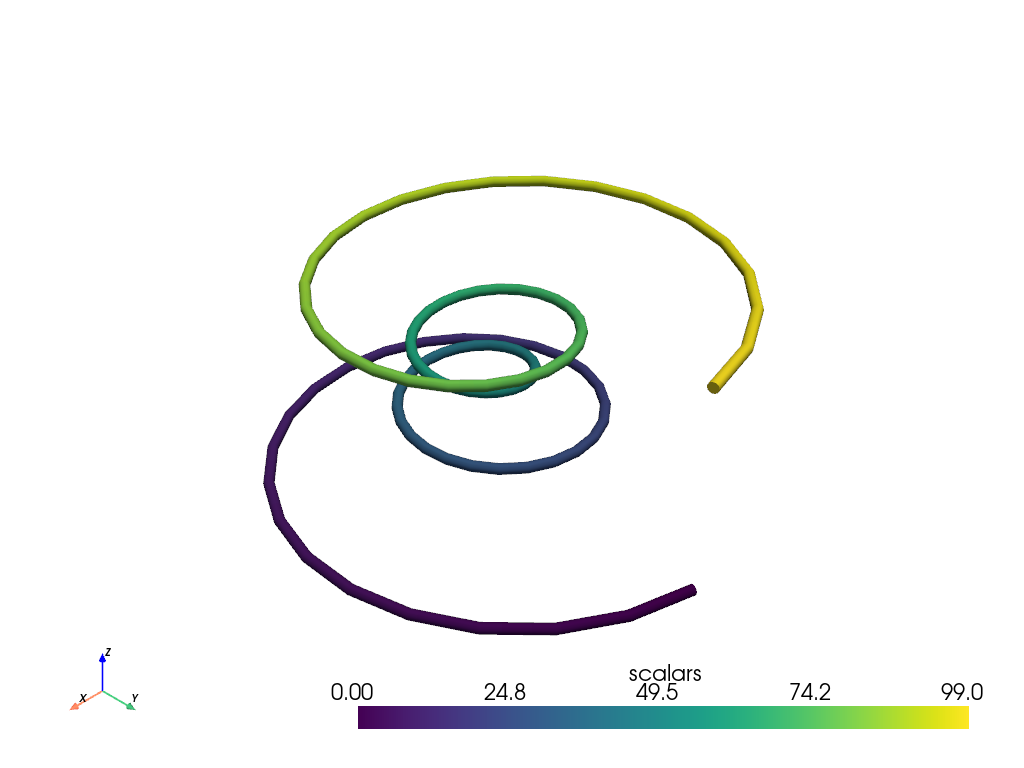
そのチューブは,各線分セグメントに鋭いエッジを持っています.これは,すべての点に対して単一のポリラインセルを作成することで緩和できます.
def polyline_from_points(points):
    poly = pv.PolyData()
    poly.points = points
    the_cell = np.arange(0, len(points), dtype=np.int_)
    the_cell = np.insert(the_cell, 0, len(points))
    poly.lines = the_cell
    return poly


polyline = polyline_from_points(points)
polyline['scalars'] = np.arange(polyline.n_points)
tube = polyline.tube(radius=0.1)
tube.plot(smooth_shading=True)
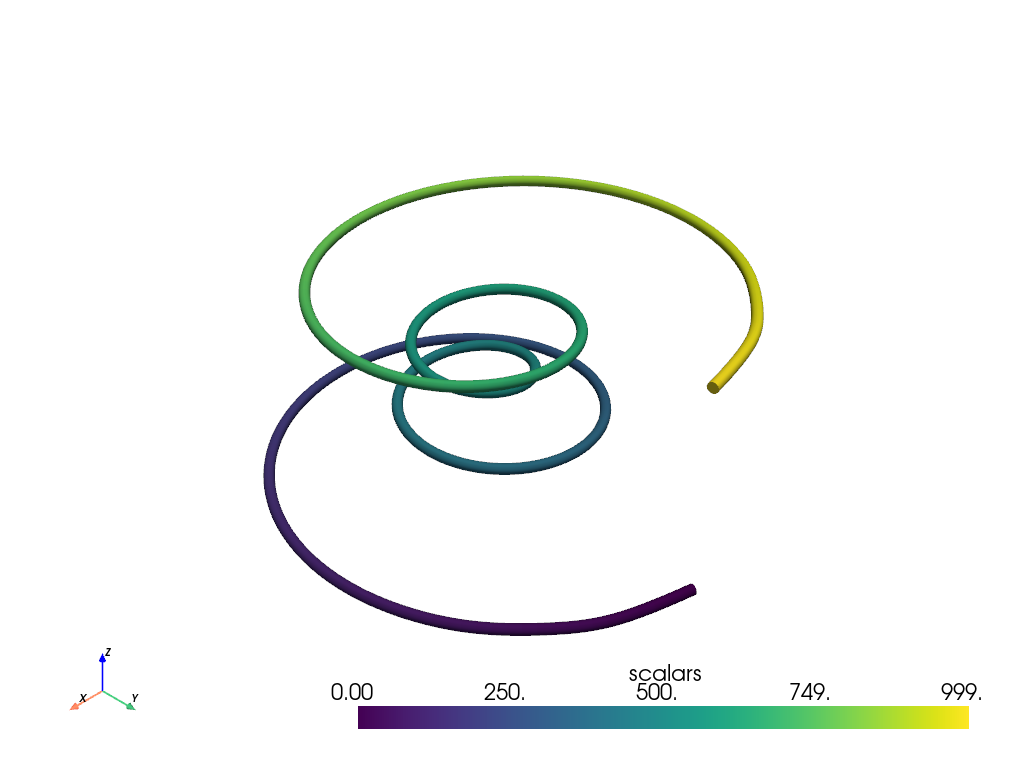
これらの点をパラメトリックスプライン上に補間することもできます.
スプラインをチューブとしてプロットします
# add scalars to spline and plot it
spline['scalars'] = np.arange(spline.n_points)
tube = spline.tube(radius=0.1)
tube.plot(smooth_shading=True)
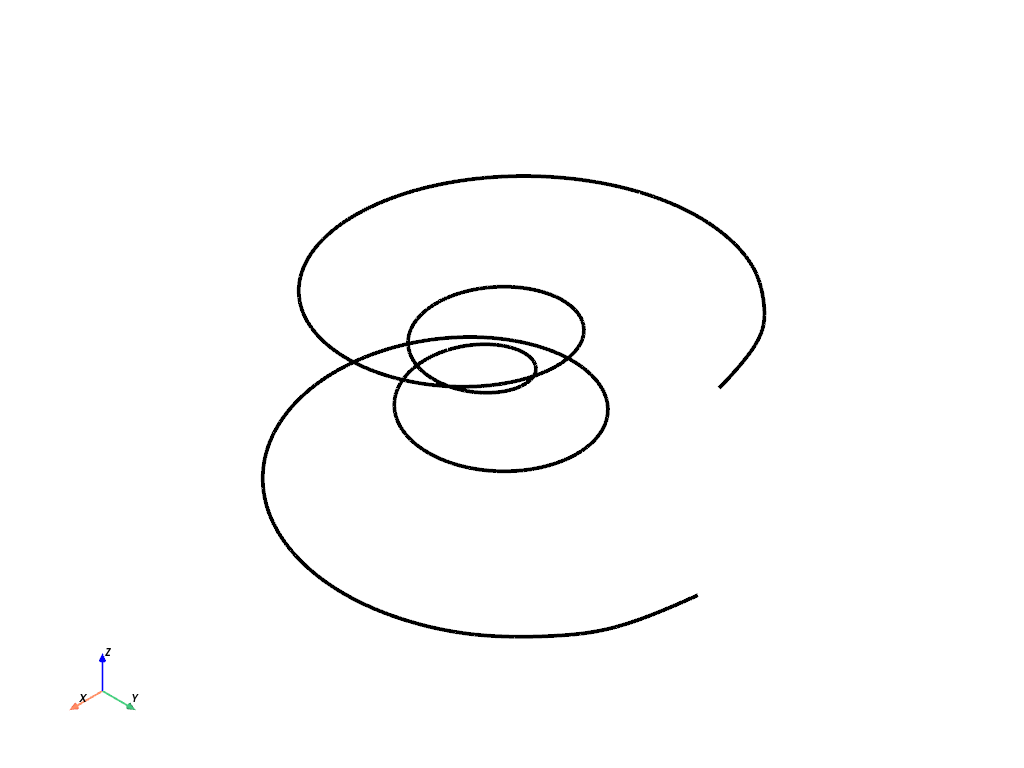
スプラインは,プレーンラインとしてプロットすることもできます.
# generate same spline with 400 interpolation points
spline = pv.Spline(points, 400)

# plot without scalars
spline.plot(line_width=4, color='k')
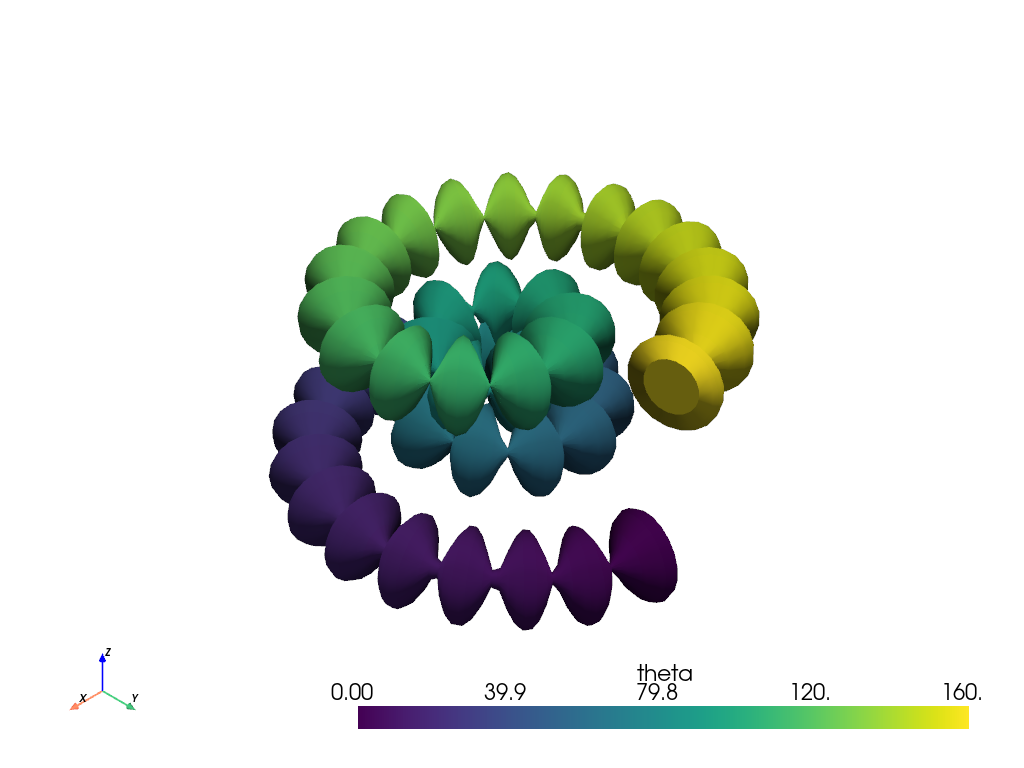
チューブの半径は,スカラーで変調することができます.
spline['theta'] = 0.4 * np.arange(len(spline.points))
spline['radius'] = np.abs(np.sin(spline['theta']))
tube = spline.tube(scalars='radius', absolute=True)
tube.plot(scalars='theta', smooth_shading=True)
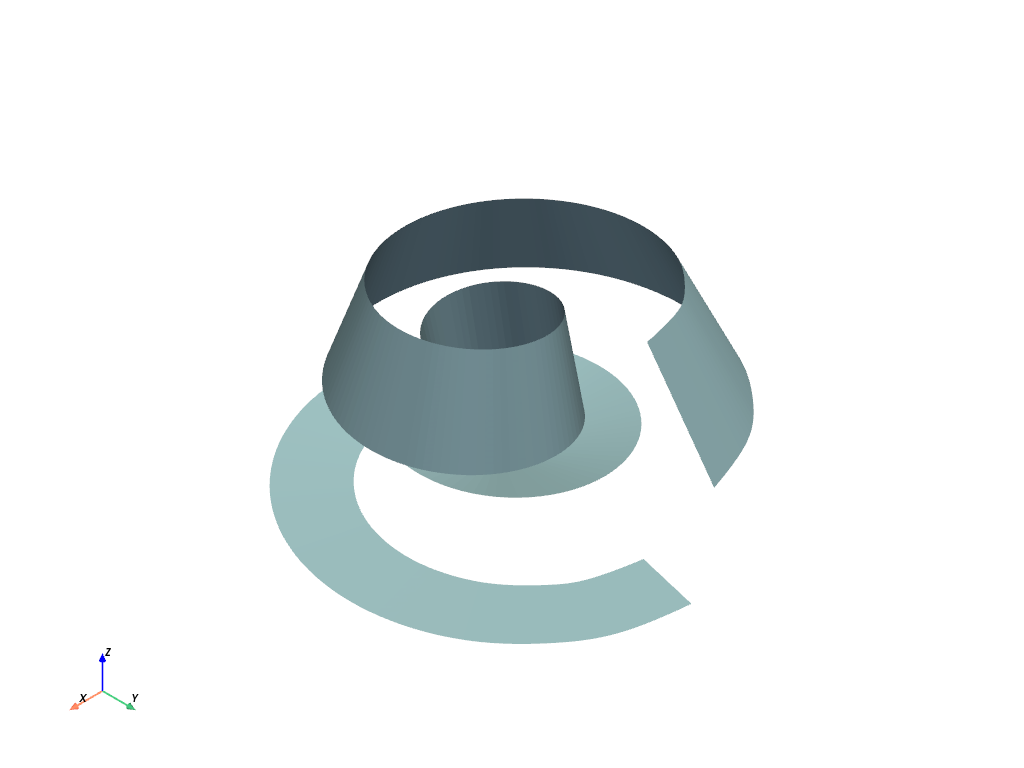
リボン#
Any of the lines from the examples above can be used to create ribbons.
Take a look at the pyvista.PolyDataFilters.ribbon() filter.
ribbon = spline.compute_arc_length().ribbon(width=0.75, scalars='arc_length')
ribbon.plot(color=True)
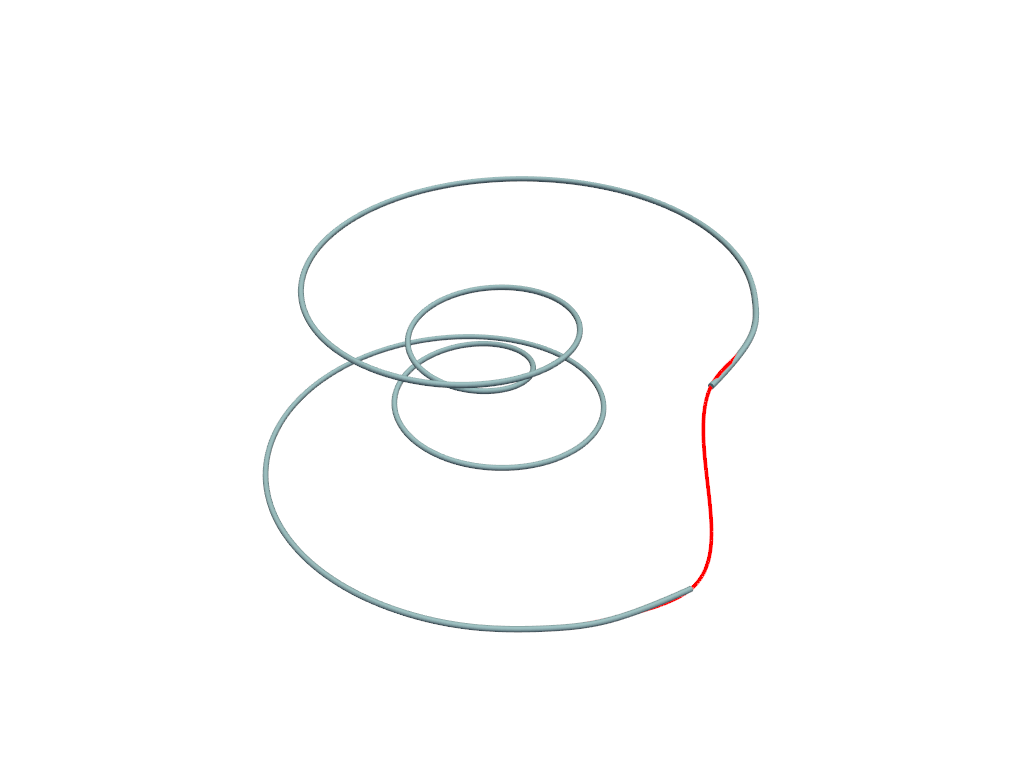
Closing a Spline#
Create a spline and its closed counterpart.
spline = pv.Spline(points, 1000)
spline_closed = pv.Spline(points, 1000, closed=True)
pl = pv.Plotter()
pl.add_mesh(spline.tube(radius=0.05))
pl.add_mesh(spline_closed, line_width=4, color='r')
pl.show()
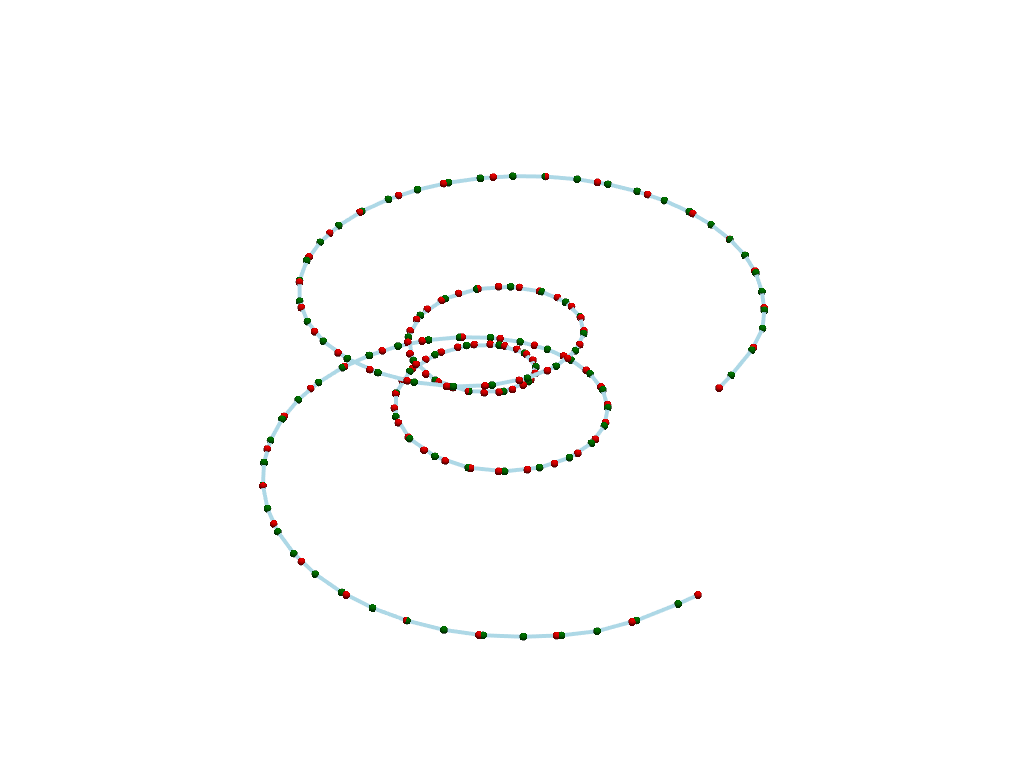
Parametrizing by Length Versus Index#
Create a spline by parametrizing based on length (default) or point index.
pl = pv.Plotter()
spline = pv.Spline(points, parametrize_by='length')
spline_by_index = pv.Spline(points, parametrize_by='index')
pl.add_mesh(spline, line_width=4)
pl.add_mesh(spline.points, color='g', point_size=8.0, render_points_as_spheres=True)
pl.add_mesh(
    spline_by_index.points, color='r', point_size=8.0, render_points_as_spheres=True
)
pl.show()
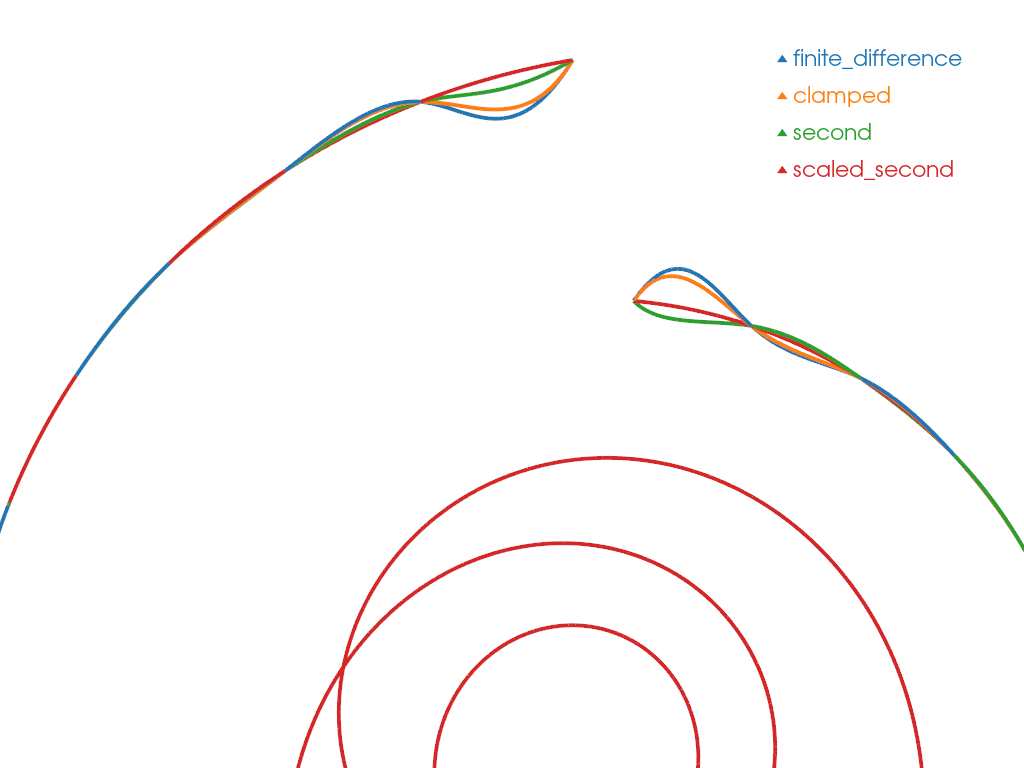
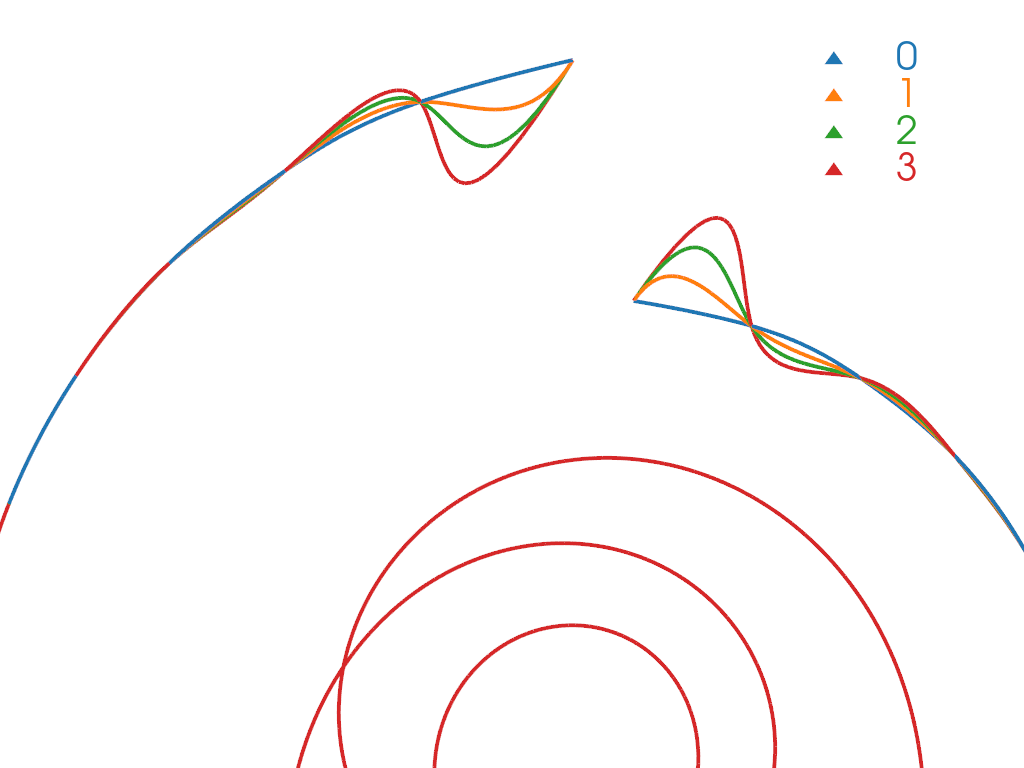
Boundary Constraints#
Create a spline and see the effect of boundary constraint.
Boundary type can be 'finite_difference', 'clamped', 'second', 'scaled_second'
with the definition of the boundary types in pyvista.Spline().
To visualize the different splines, we label each one using integer ID scalars and merge them into a single mesh.
pl = pv.Plotter()
mesh = pv.PolyData()
constraint_map = {'finite_difference': 0, 'clamped': 1, 'second': 2, 'scaled_second': 3}
for constraint, constraint_id in constraint_map.items():
    val = None if constraint == 'finite_difference' else 1.0
    spline = pv.Spline(
        points,
        1000,
        boundary_constraints=constraint,
        boundary_values=val,
    )
    spline.cell_data['boundary_constraint'] = np.array([constraint_id], dtype=np.uint8)
    mesh = pv.merge([mesh, spline], merge_points=False)

colored_mesh, color_map = mesh.color_labels(
    output_scalars='boundary_constraint', return_dict=True
)
legend_map = dict(zip(constraint_map.keys(), color_map.values(), strict=True))
pl.add_mesh(colored_mesh, line_width=4, rgb=True)
pl.add_legend(legend_map)
cpos = pv.CameraPosition(
    position=(2.0, -2.0, 11.0), focal_point=(-0.8, 3.3, -0.4), viewup=(0.0, 1.0, 0.5)
)
pl.camera_position = cpos
pl.show()
Boundary Values#
Create a spline and see the effect of boundary value. It can be set at left and right value and has no effect for boundary type 0.
pl = pv.Plotter()
mesh = pv.PolyData()
for boundary_value in range(4):
    spline = pv.Spline(
        points,
        1000,
        boundary_constraints='clamped',
        boundary_values=boundary_value,
    )
    spline.cell_data['boundary_value'] = np.array([boundary_value], dtype=float)
    mesh = pv.merge([mesh, spline], merge_points=False)

colored_mesh, color_map = mesh.color_labels(
    output_scalars='boundary_value', return_dict=True
)
pl.add_mesh(colored_mesh, line_width=4, rgb=True)
pl.add_legend(color_map)
pl.camera_position = cpos
pl.show()
Total running time of the script: (0 minutes 1.253 seconds)