ヘルパー#
pyvista モジュールには,メッシュの作成と操作,またはVTKデータセットとのインターフェースを簡素化するためのいくつかの関数が含まれています.
VTKデータセットのラップ#
- helpers.wrap() DataObject | pyvista_ndarray | None[ソース]#
与えられたVTKデータオブジェクトを適切なPyVistaデータオブジェクトにラップします.
その他,対応しているフォーマットは以下の通りです.
2D
numpy.ndarrayXYZの頂点を表す.3D
numpy.ndarrayボリュームを表します.値はスカラーです.3D
trimesh.Trimeshmesh usingfrom_trimesh().3D
meshio.Meshmesh usingfrom_meshio().
バージョン 0.38.0 で変更: 渡されたオブジェクトがすでにラップされたPyVistaオブジェクトである場合,これはノー・オペレーションで,そのオブジェクトを直接返します.以前のバージョンのPyVistaでは,これは浅いコピーを実行します.
バージョン 0.47 で変更: If wrapping a
Trimeshobject, any arrays are now wrapped directly (no copies).- パラメータ:
- dataset
numpy.ndarray|trimesh.Trimesh|vtk.DataSet ラップするデータセット.
- dataset
- 戻り値:
pyvista.DataSetPyVistaのラッピングデータセット.
例
ランダムなポイントクラウドを表すnumpy配列をラップする.
>>> import numpy as np
>>> import pyvista as pv
>>> points = np.random.default_rng().random((10, 3))
>>> cloud = pv.wrap(points)
>>> cloud
PolyData (...)
  N Cells:    10
  N Points:   10
  N Strips:   0
  X Bounds:   ...
  Y Bounds:   ...
  Z Bounds:   ...
  N Arrays:   0
VTKオブジェクトをラップする.
>>> import pyvista as pv
>>> import vtk
>>> points = vtk.vtkPoints()
>>> p = [1.0, 2.0, 3.0]
>>> vertices = vtk.vtkCellArray()
>>> pid = points.InsertNextPoint(p)
>>> _ = vertices.InsertNextCell(1)
>>> _ = vertices.InsertCellPoint(pid)
>>> point = vtk.vtkPolyData()
>>> _ = point.SetPoints(points)
>>> _ = point.SetVerts(vertices)
>>> mesh = pv.wrap(point)
>>> mesh
PolyData (...)
  N Cells:    1
  N Points:   1
  N Strips:   0
  X Bounds:   1.000e+00, 1.000e+00
  Y Bounds:   2.000e+00, 2.000e+00
  Z Bounds:   3.000e+00, 3.000e+00
  N Arrays:   0
Trimeshオブジェクトをラップする.
>>> import trimesh
>>> import pyvista as pv
>>> points = [[0, 0, 0], [0, 0, 1], [0, 1, 0]]
>>> faces = [[0, 1, 2]]
>>> tmesh = trimesh.Trimesh(points, faces=faces, process=False)
>>> mesh = pv.wrap(tmesh)
>>> mesh
PolyData (0x7fc55ff27ad0)
  N Cells:  1
  N Points: 3
  X Bounds: 0.000e+00, 0.000e+00
  Y Bounds: 0.000e+00, 1.000e+00
  Z Bounds: 0.000e+00, 1.000e+00
  N Arrays: 0
単純化された3角形メッシュの作成#
- points.make_tri_mesh(faces: NumpyArray[int]) PolyData[ソース]#
点と面の配列を使用して
pyvista.PolyDataメッシュを作成します.ポイントのNx 3配列と3角形のインデックスのMx 3配列からメッシュを作成し,N個の頂点とM個の3角形を持つメッシュを作成します.この機能は,標準のVTK "padding" カラムを必要とせず,メッシュ作成を簡素化します.
- パラメータ:
- points
np.ndarray 3角形メッシュの頂点を格納する
(N, 3)の形を持つポイントの配列.- faces
np.ndarray 3角形のインデックスを含みます
(M, 3)の形を持つインデックスの配列.
- points
- 戻り値:
pyvista.PolyData3角形メッシュを含みますPolyDataインスタンス.
例
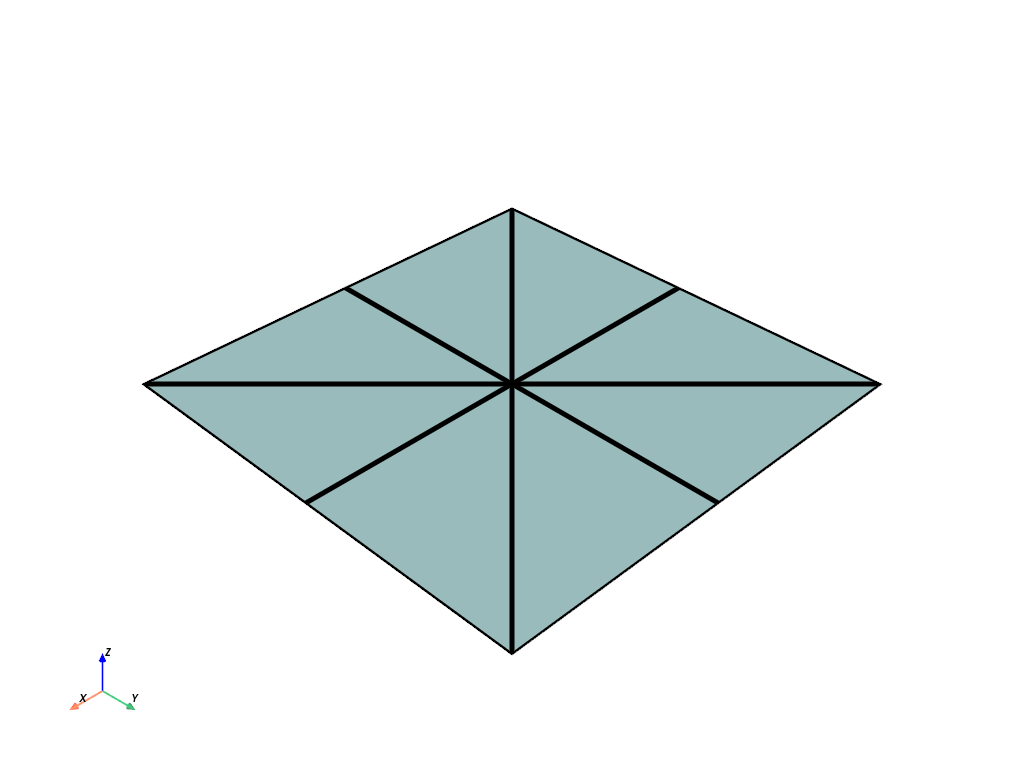
次の使用例は,単位正方形を9つの頂点と8つの面を持つ3角形メッシュに離散化します.
>>> import numpy as np
>>> import pyvista as pv
>>> points = np.array(
...     [
...         [0, 0, 0],
...         [0.5, 0, 0],
...         [1, 0, 0],
...         [0, 0.5, 0],
...         [0.5, 0.5, 0],
...         [1, 0.5, 0],
...         [0, 1, 0],
...         [0.5, 1, 0],
...         [1, 1, 0],
...     ]
... )
>>> faces = np.array(
...     [
...         [0, 1, 4],
...         [4, 7, 6],
...         [2, 5, 4],
...         [4, 5, 8],
...         [0, 4, 3],
...         [3, 4, 6],
...         [1, 2, 4],
...         [4, 8, 7],
...     ]
... )
>>> tri_mesh = pv.make_tri_mesh(points, faces)
>>> tri_mesh.plot(show_edges=True, line_width=5)
点からの線分#
- points.lines_from_points(close: bool = False) PolyData[ソース]#
点の配列を指定して,接続された線分セットを作成します.
- パラメータ:
- pointsarray_like[
float] 接続されたセグメントの頂点を表すポイント.たとえば,2つの線分セグメントは
np.array([[0, 0, 0], [1, 0, 0], [1, 1, 0]])のように表されます.- closebool, default:
False Trueの場合,線分セグメントを閉じてループを作成します.
- pointsarray_like[
- 戻り値:
pyvista.PolyDataラインやセルを使用したPolyData.
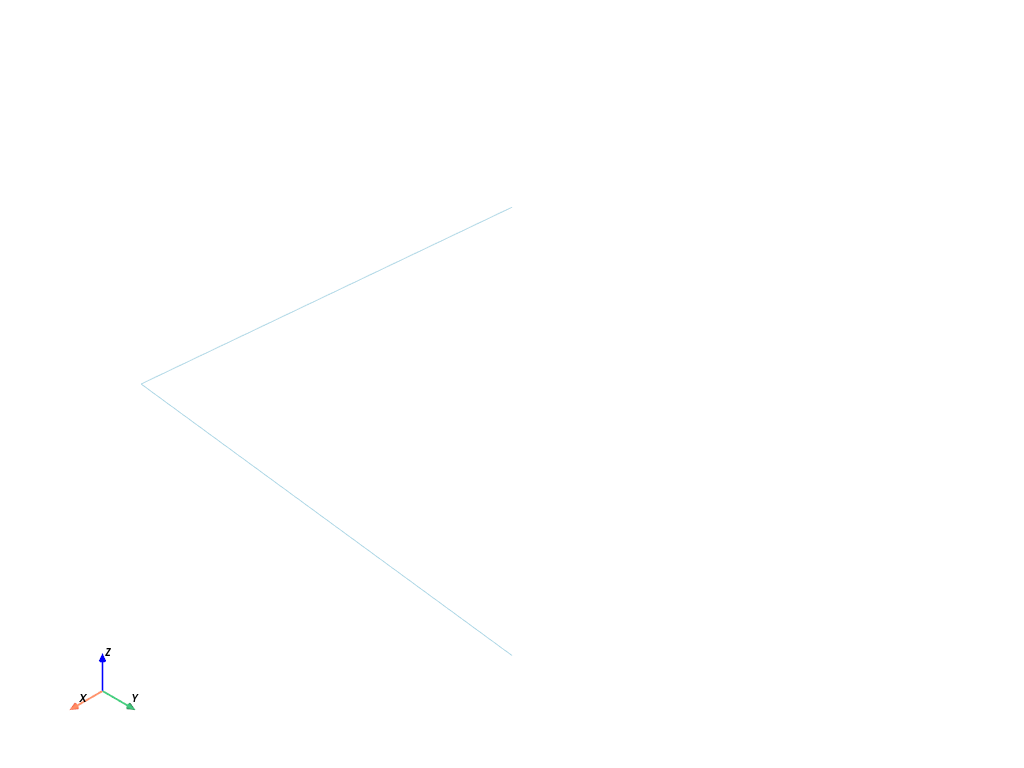
例
>>> import numpy as np
>>> import pyvista as pv
>>> points = np.array([[0, 0, 0], [1, 0, 0], [1, 1, 0]])
>>> poly = pv.lines_from_points(points)
>>> poly.plot(line_width=5)
点からの線分セグメント#
- points.line_segments_from_points() PolyData[ソース]#
点から接続されていない線分セグメントを生成します.
点が線分セグメントと偶数個の点として順序付けられる.
- パラメータ:
- pointsarray_like[
float] 線分セグメントを表すポイント.2つの頂点が1つの線分セグメントを表すため,偶数を指定する必要があります.たとえば,2つの線分セグメントは
np.array([[0, 0, 0], [1, 0, 0], [1, 0, 0], [1, 1, 0]])のように表されます.
- pointsarray_like[
- 戻り値:
pyvista.PolyDataラインやセルを使用したPolyData.
例
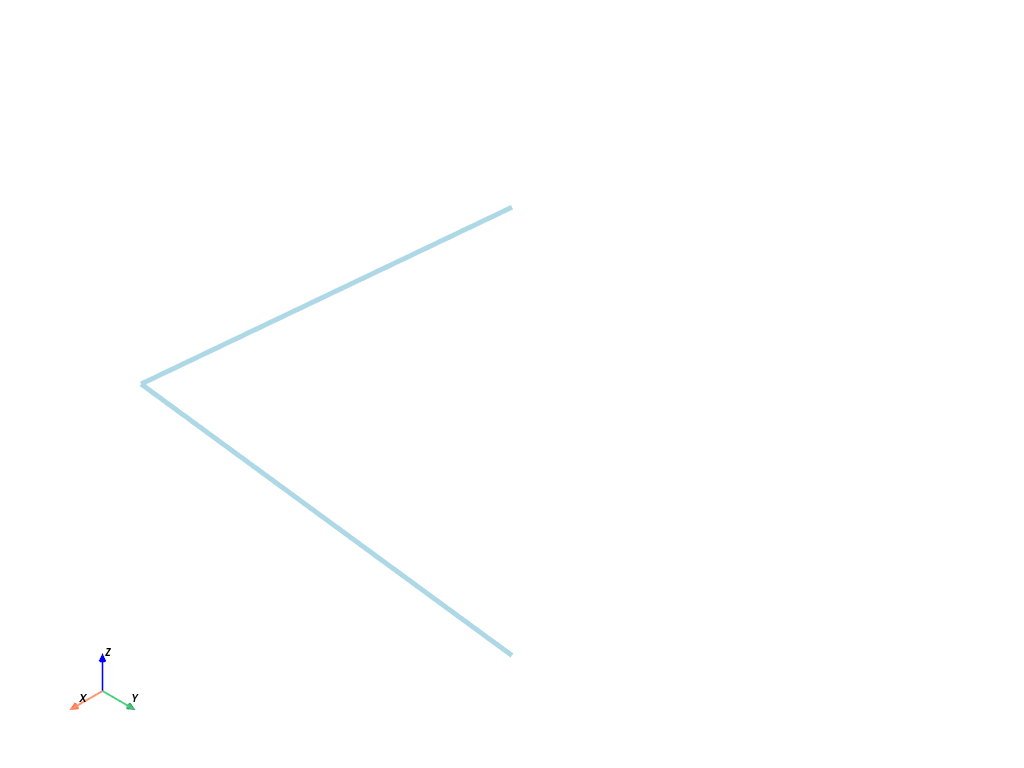
次の使用例は,2つの線分を直角にプロットします.
>>> import pyvista as pv
>>> import numpy as np
>>> points = np.array([[0, 0, 0], [1, 0, 0], [1, 0, 0], [1, 1, 0]])
>>> lines = pv.line_segments_from_points(points)
>>> lines.plot()
VTKデータ型との変換#
- arrays.convert_array( ) ndarray[tuple[Any, ...], dtype[Any]] | vtkAbstractArray | None[ソース]#
NumPy配列を vtkDataArray に,またはその逆に変換します.
- パラメータ:
- arr
np.ndarray| vtkDataArray 変換する数値配列あるいは vtkDataArray .
- name
str,optional VTKのデータ配列の名前.
- deepbool, default:
False 入力がnumpy arrayであれば,値を深くコピーします.
- array_type
int,optional vtkType.hで指定されたVTK配列タイプID。
- arr
- 戻り値:
- outputvtkDataArray |
numpy.ndarray 変換後の配列です。入力が
numpy.ndarrayなら vtkDataArray を返し、 vtkDataArray なら NumPyndarrayを返します。
- outputvtkDataArray |
平面を点にフィット#
- points.fit_plane_to_points( ) PolyData | tuple[PolyData, float, NumpyArray[float]][ソース]#
Fit a plane to points using its
principal_axes().平面は,ポイントの範囲に合うように自動的にサイズと向きが調整されます.
バージョン 0.42.0 で変更: これで、生成された平面の大きさと向きが点に合うようになりました。
バージョン 0.42.0 で変更: The center of the plane (returned if
return_meta=True) is now computed as the center of the generated plane mesh. In previous versions, the center of the input points was returned.バージョン 0.45.0 で変更: The internal method used for fitting the plane has changed. Previously, singular value decomposition (SVD) was used, but eigenvectors are now used instead. See warning below.
警告
The sign of the plane's normal vector prior to version 0.45 may differ from the latest version. This may impact methods which rely on the plane's direction. Use
init_normalto control the sign explicitly.- パラメータ:
- pointsarray_like[
float] 平面を通過させるための
[N x 3]個の点の列の大きさ.- return_metabool, default:
False もし
Trueならば,生成された平面の中心と法線も返します.- resolution
int, default: 10 Number of points on the plane mesh along its edges. Specify two numbers to set the resolution along the plane's long and short edge (respectively) or a single number to set both edges to have the same resolution.
Added in version 0.45.0.
- init_normal
VectorLike[float] |str,optional 平面の法線がこのベクトルに最も合うように反転させます。 軸を名前で指定するベクトルまたは文字列です (例:
'x'または'-x', など)。Added in version 0.45.0.
- pointsarray_like[
- 戻り値:
pyvista.PolyData平面メッシュです.
pyvista.pyvista_ndarrayreturn_meta=Trueの場合は平面の中心.pyvista.pyvista_ndarrayreturn_meta=Trueの場合は平面の法線.
参考
fit_line_to_points点の第一主軸を使って直線をフィッティングします。
principal_axes点の集合に最も適合する軸ベクトルを計算します。
例
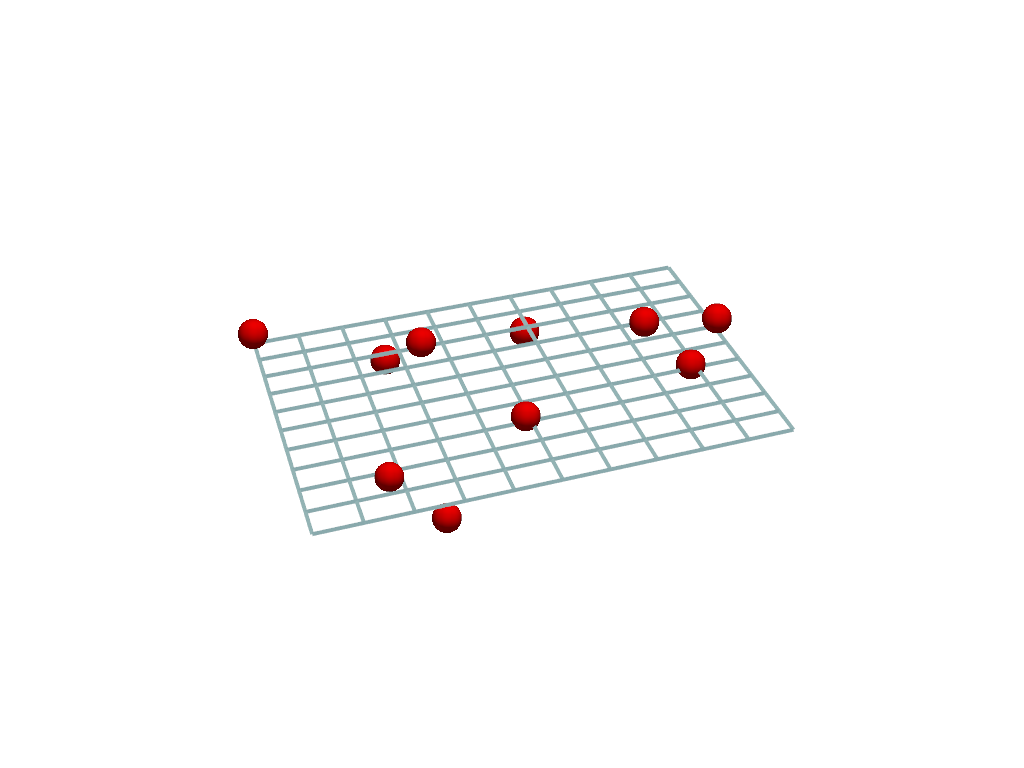
ランダムな点群に平面を当てはめます.
>>> import pyvista as pv
>>> import numpy as np
>>> from pyvista import examples
>>>
>>> rng = np.random.default_rng(seed=0)
>>> cloud = rng.random((10, 3))
>>> cloud[:, 2] *= 0.1
>>>
>>> plane = pv.fit_plane_to_points(cloud)
Plot the point cloud and fitted plane.
>>> pl = pv.Plotter()
>>> _ = pl.add_mesh(plane, style='wireframe', line_width=4)
>>> _ = pl.add_points(
...     cloud,
...     render_points_as_spheres=True,
...     color='r',
...     point_size=30,
... )
>>> pl.show()
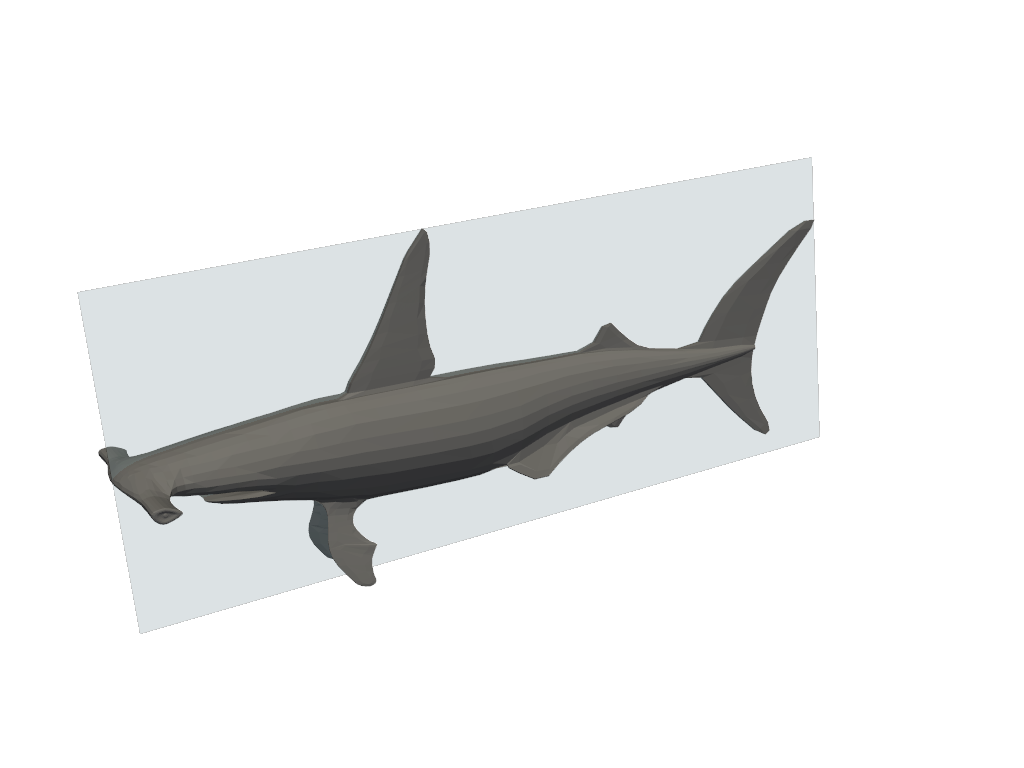
Fit a plane to a mesh and return its metadata. Set the plane resolution to 1 so that the plane has no internal points or edges.
>>> mesh = examples.download_shark()
>>> plane, center, normal = pv.fit_plane_to_points(
...     mesh.points, return_meta=True, resolution=1
... )
Plot the mesh and fitted plane.
>>> pl = pv.Plotter()
>>> _ = pl.add_mesh(plane, show_edges=True, opacity=0.25)
>>> _ = pl.add_mesh(mesh, color='gray')
>>> pl.camera_position = pv.CameraPosition(
...     position=(-117, 76, 235),
...     focal_point=(1.69, -1.38, 0),
...     viewup=(0.189, 0.957, -0.22),
... )
>>> pl.show()
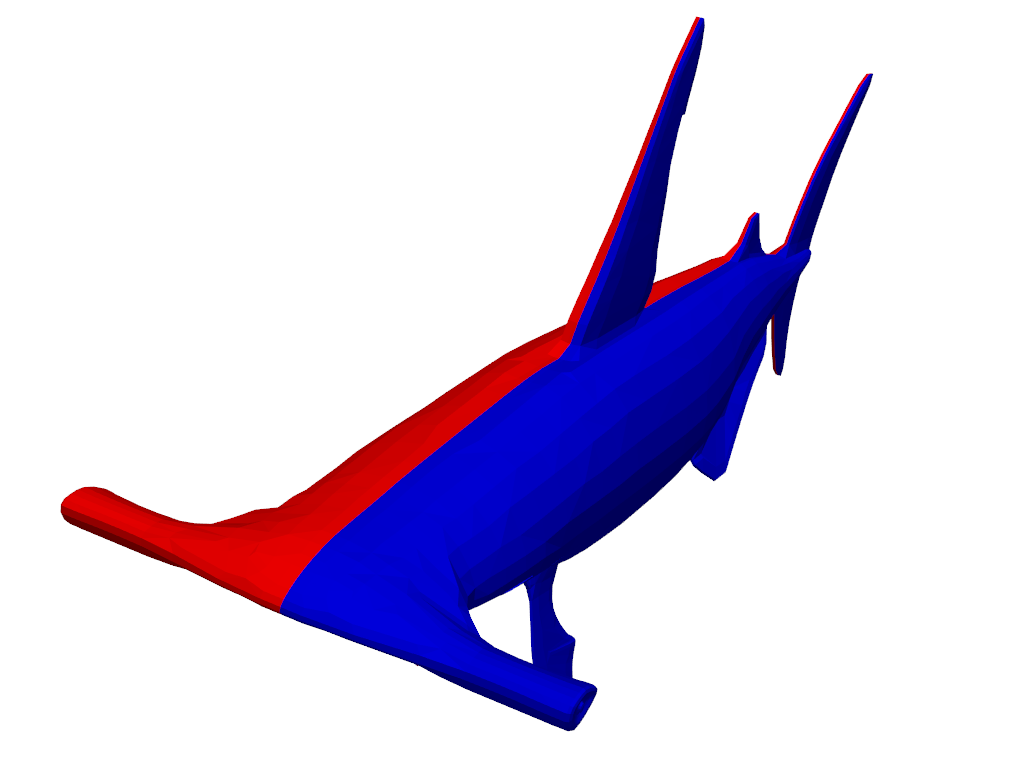
Use the metadata with
pyvista.DataObjectFilters.clip()to split the mesh into two.>>> first_half, second_half = mesh.clip( ... origin=center, normal=normal, return_clipped=True ... )
Plot the two halves of the clipped mesh.
>>> pl = pv.Plotter()
>>> _ = pl.add_mesh(first_half, color='red')
>>> _ = pl.add_mesh(second_half, color='blue')
>>> pl.camera_position = pv.CameraPosition(
...     position=(-143, 43, 40),
...     focal_point=(-8.7, -11, -14),
...     viewup=(0.25, 0.92, -0.29),
... )
>>> pl.show()
Note that it is pointing in the positive z-direction.
>>> normal
pyvista_ndarray([0.0, 0.0, 1.0], dtype=float32)
Use
init_normalto flip the sign and make it negative instead.>>> _, _, normal = pv.fit_plane_to_points( ... mesh.points, return_meta=True, init_normal='-z' ... ) >>> normal pyvista_ndarray([0.0, 0.0, -1.0], dtype=float32)
Fit Line to Points#
- points.fit_line_to_points( ) PolyData | tuple[PolyData, float, NumpyArray[float]][ソース]#
Fit a line to points using its
principal_axes().The line is automatically sized and oriented to fit the extents of the points.
Added in version 0.45.0.
- パラメータ:
- points
MatrixLike[float] Size
[N x 3]array of points to fit a line through.- resolution
int, default: 1 Number of pieces to divide the line into.
- init_direction
VectorLike[float],optional Flip the direction of the line's points such that it best aligns with this vector. Can be a vector or string specifying the axis by name (e.g.
'x'or'-x', etc.).- return_metabool, default:
False If
True, also returns the length (magnitude) and direction of the line.
- points
- 戻り値:
pyvista.PolyDataラインメッシュです.
floatLine length if
return_meta=True.numpy.ndarrayLine direction (unit vector) if
return_meta=True.
参考
fit_plane_to_pointsFit a plane using the first two principal axes of the points.
principal_axes点の集合に最も適合する軸ベクトルを計算します。
例
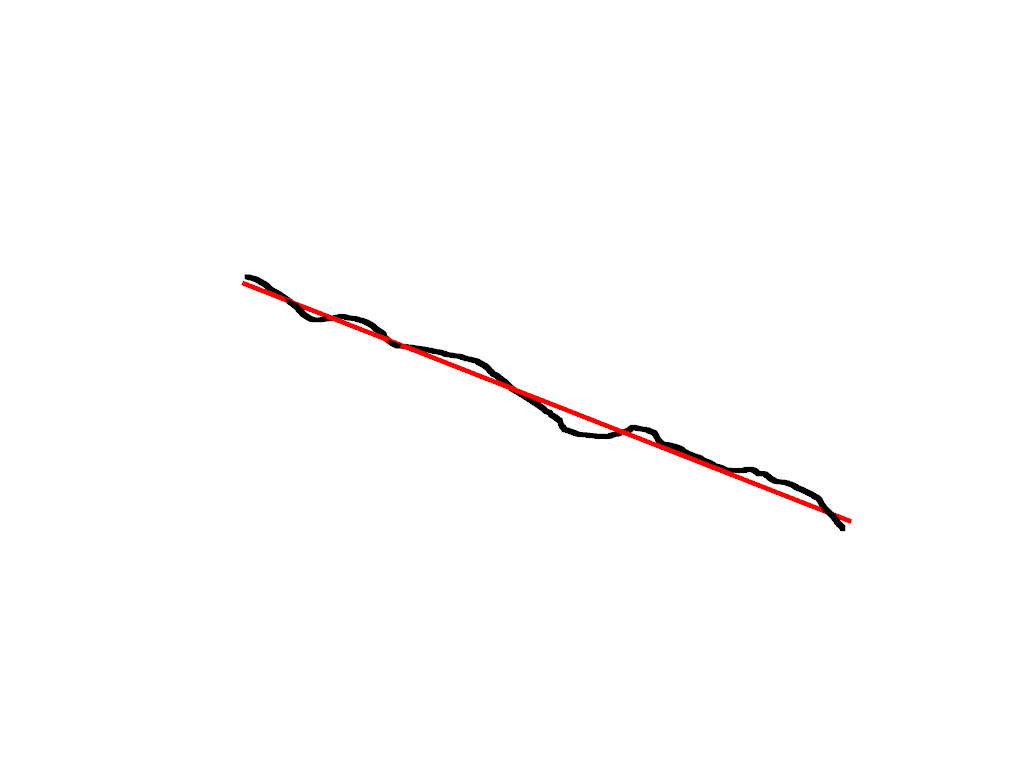
Download a point cloud. The points trace a path along topographical surface.
>>> import pyvista as pv
>>> from pyvista import examples
>>> mesh = examples.download_gpr_path()
Fit a line to the points and plot the result. The line of best fit is colored red.
>>> line = pv.fit_line_to_points(mesh.points)
>>> pl = pv.Plotter()
>>> _ = pl.add_mesh(mesh, color='black', line_width=10)
>>> _ = pl.add_mesh(line, color='red', line_width=5)
>>> pl.show()
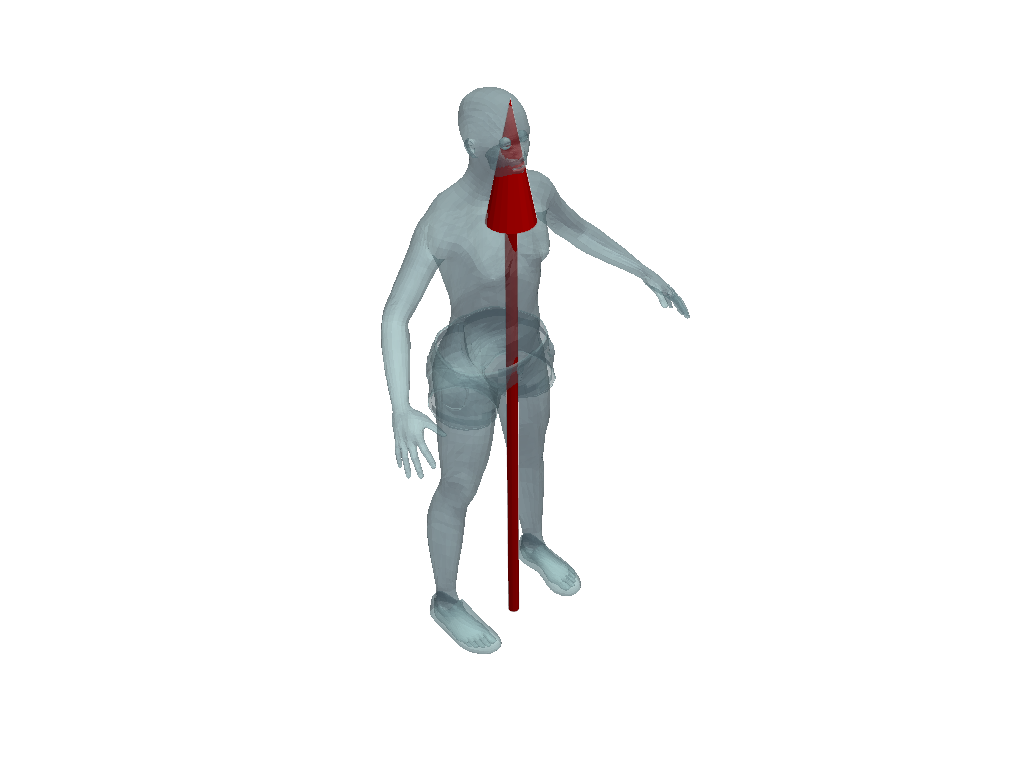
Fit a line to a mesh and return the metadata.
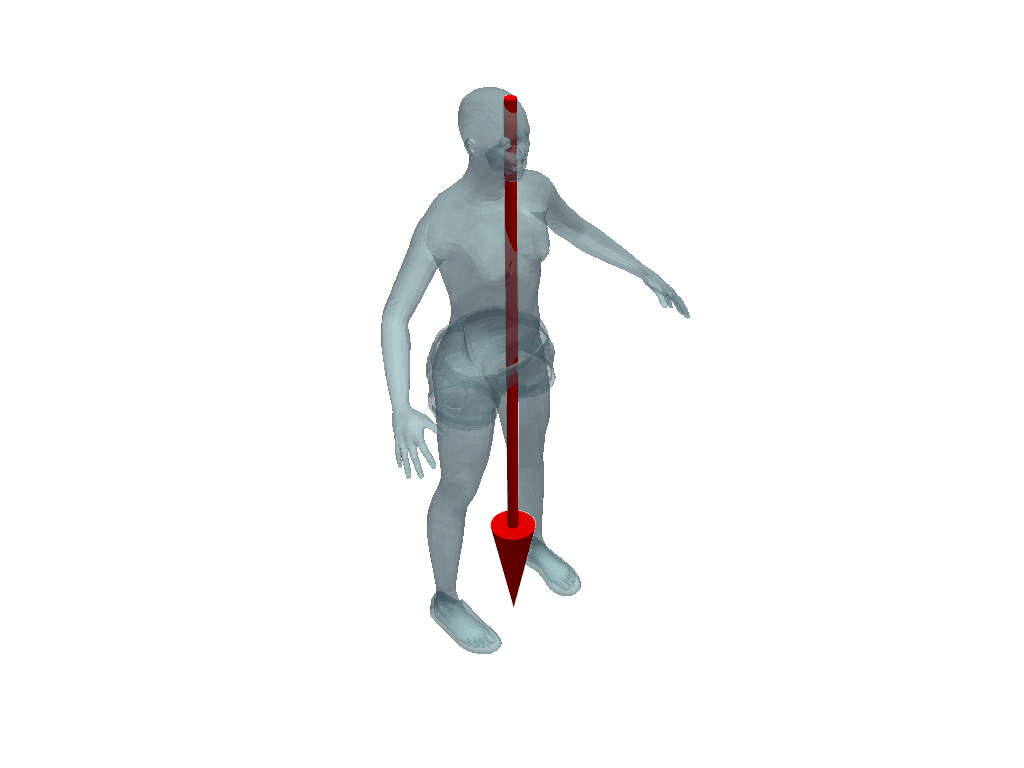
>>> mesh = examples.download_human()
>>> line, length, direction = pv.fit_line_to_points(
...     mesh.points, return_meta=True
... )
Show the length of the line.
>>> length
167.6145
線の方向を矢印で示します。
>>> arrow = pv.Arrow(
...     start=line.points[0],
...     direction=direction,
...     scale=length,
...     tip_length=0.2,
...     tip_radius=0.04,
...     shaft_radius=0.01,
... )
>>> pl = pv.Plotter()
>>> _ = pl.add_mesh(mesh, opacity=0.5)
>>> _ = pl.add_mesh(arrow, color='red')
>>> pl.show()
init_directionを正のz軸にセットし、線の方向を反転させます。>>> mesh = examples.download_human() >>> line, length, direction = pv.fit_line_to_points( ... mesh.points, init_direction='z', return_meta=True ... )
結果を矢印で再度プロットします。
>>> arrow = pv.Arrow(
...     start=line.points[0],
...     direction=direction,
...     scale=length,
...     tip_length=0.2,
...     tip_radius=0.04,
...     shaft_radius=0.01,
... )
>>> pl = pv.Plotter()
>>> _ = pl.add_mesh(mesh, opacity=0.5)
>>> _ = pl.add_mesh(arrow, color='red')
>>> pl.show()