pyvista.Plotter.add_legend#
- Plotter.add_legend(
- labels=None,
- bcolor=None,
- border=False,
- size=(0.2, 0.2),
- name=None,
- loc='upper right',
- face=None,
- font_family=None,
- background_opacity=1.0,
凡例をレンダリングウィンドウに追加します.
エントリは,項目ごとに1つの文字列とカラーエントリを含みますリストである必要があります.
- パラメータ:
- labels
list|dict,optional Noneに設定すると,次で指定した既存のラベルが使用されます.For dict inputs, the keys are used as labels and the values are used as the colors. Labels must be strings, and colors can be any
ColorLike.For list inputs, the list must contain one entry for each item to be added to the legend. Each entry can contain one of the following:
2つの文字列 ([label, color]) ,
labelは追加するアイテムの名前,colorは追加するラベルの色.Three strings ([label, color, face]) where
labelis the name of the item to add,coloris the color of the label to add, andfaceis a string which defines the face (i.e.circle,triangle,box, etc.).facecould be also"none"(no face shown for the entry), or apyvista.PolyData.キー
labelを持つ辞書.オプションでキーcolorとfaceを追加することもできます.これらのキーの値は文字列にすることができます.faceキーの場合,pyvista.PolyDataにすることもできます.
- bcolor
ColorLike, default: (0.5, 0.5, 0.5) 背景色.3つの項目0から1のRGBカラーリスト,またはmatplotlibカラー文字列(例:白色の場合は
'w'または'white')のいずれかです.Noneの場合,凡例の背景は使用不可になります.- borderbool, default:
False 凡例の周囲に境界線を表示するかどうかをコントロールします.デフォルトはFalseです.
- sizesequence[
float], default: (0.2, 0.2) 2つの浮動小数点シーケンスで,それぞれが0と1の間の浮動小数点です.たとえば,
(0.1, 0.1)と指定すると,凡例は図形ウィンドウ全体のサイズの10%のサイズになります.- name
str,optional 簡単に更新できるように,追加したアクターの名前.この名前のアクターがレンダリングウィンドウに既に存在する場合は,新しいアクターに置き換えられます.
- loc
str, default: "upper right" 位置情報の文字列です. 以下のいずれかになります:
'upper right''upper left''lower left''lower right''center left''center right''lower center''upper center''center'
- face
str|pyvista.PolyData,optional Face shape of legend face. Defaults to a triangle for most meshes, with the exception of glyphs where the glyph is shown (e.g. arrows).
You may set it to one of the following:
None:
"none"線:
"-"か"line"3角形:
"^"か'triangle'円:
"o"か'circle'長方形:
"r"か'rectangle'カスタム:
pyvista.PolyData
Passing
"none"removes the legend face. A custom face can be created usingpyvista.PolyData. This will be rendered from the XY plane.- font_family
str,optional フォントファミリ.
'courier','times', または arial'`` のいずれかでなければなりません.デフォルトはpyvista.global_theme.font.familyです.- background_opacity
float, default: 1.0 背景の不透明度を設定します.
- labels
- 戻り値:
- vtkLegendBoxActor
凡例のアクター.
参考
例
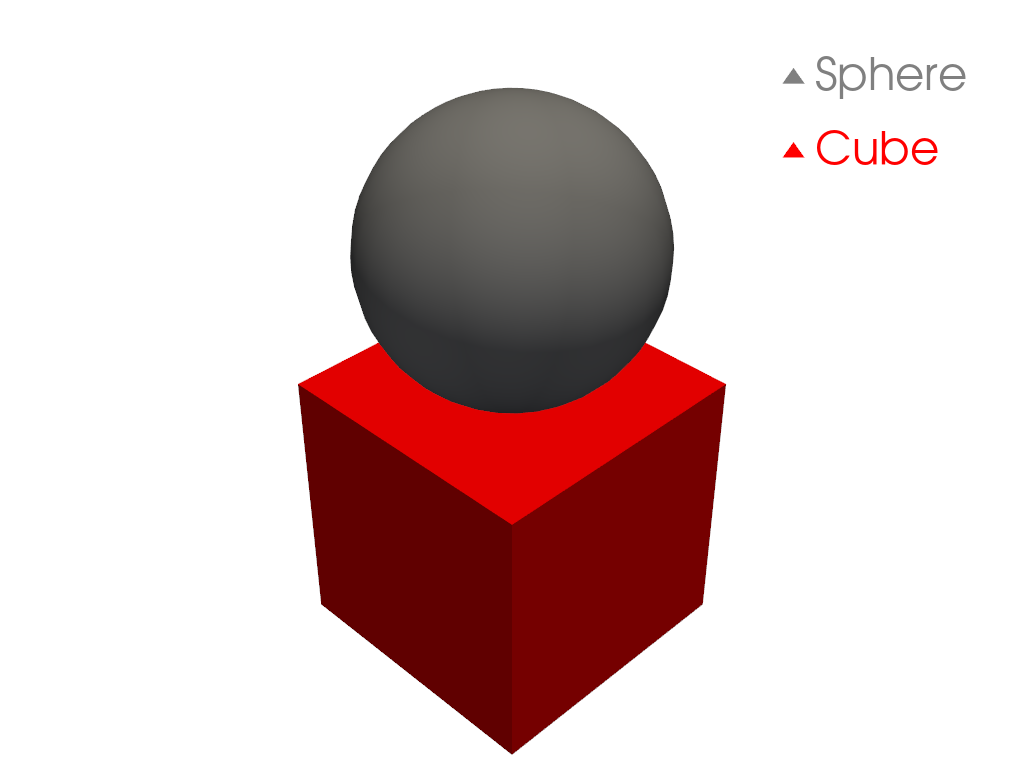
add_meshを使用する際に,メッシュにラベルを付けて凡例を作成します.>>> import pyvista as pv >>> from pyvista import examples >>> sphere = pv.Sphere(center=(0, 0, 1)) >>> cube = pv.Cube() >>> pl = pv.Plotter() >>> _ = pl.add_mesh(sphere, color='grey', smooth_shading=True, label='Sphere') >>> _ = pl.add_mesh(cube, color='r', label='Cube') >>> _ = pl.add_legend(bcolor='w', face=None) >>> pl.show()
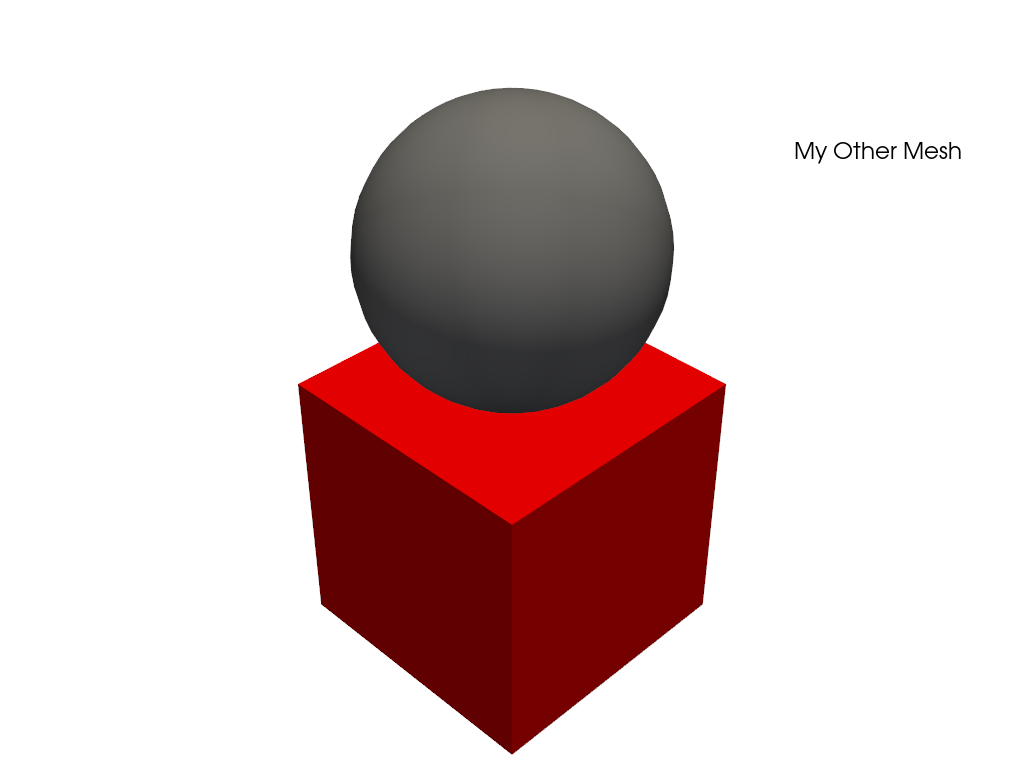
Alternatively provide labels in the plotter as a list.
>>> pl = pv.Plotter()
>>> _ = pl.add_mesh(sphere, color='grey', smooth_shading=True)
>>> _ = pl.add_mesh(cube, color='r')
>>> legend_entries = []
>>> legend_entries.append(['My Mesh', 'w'])
>>> legend_entries.append(['My Other Mesh', 'k'])
>>> _ = pl.add_legend(legend_entries)
>>> pl.show()
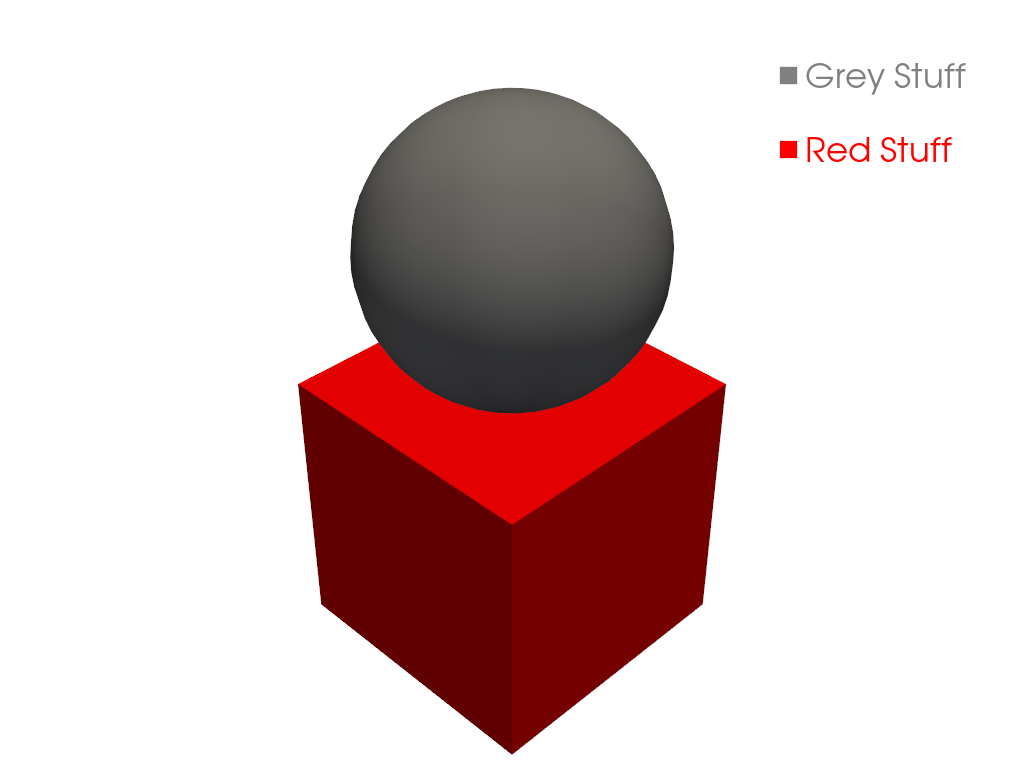
Or use a dictionary to define them.
>>> labels = {'Grey Stuff': 'grey', 'Red Stuff': 'red'}
>>> pl = pv.Plotter()
>>> _ = pl.add_mesh(sphere, color='grey', smooth_shading=True)
>>> _ = pl.add_mesh(cube, color='red')
>>> _ = pl.add_legend(labels, face='rectangle')
>>> pl.show()