pyvista.sample_function#
- sample_function(
- function: ~vtkmodules.vtkCommonDataModel.vtkImplicitFunction,
- bounds: ~collections.abc.Sequence[float] = (-1.0,
- 1.0,
- -1.0,
- 1.0,
- -1.0,
- 1.0),
- dim: ~collections.abc.Sequence[int] = (50,
- 50,
- 50),
- compute_normals: bool = False,
- output_type: ~numpy.dtype = <class 'numpy.float64'>,
- capping: bool = False,
- cap_value: float = 1.7976931348623157e+308,
- scalar_arr_name: str = 'scalars',
- normal_arr_name: str = 'normals',
- progress_bar: bool = False,
構造化された点セット上の陰関数をサンプルします.
Uses vtkSampleFunction
This method evaluates an implicit function and normals at each point in a vtkStructuredPoints. The user can specify the sample dimensions and location in space to perform the sampling.
To create closed surfaces (in conjunction with the vtkContourFilter), capping can be turned on to set a particular value on the boundaries of the sample space.
- パラメータ:
- functionvtkImplicitFunction
評価する暗黙の関数. 例えば,
perlin_noise()から生成される関数がこれにあたります.- boundssequence[
float], default: (-1.0, 1.0, -1.0, 1.0, -1.0, 1.0) 以下の形式で境界を指定します.
(x_min, x_max, y_min, y_max, z_min, z_max).
- dimsequence[
float], default: (50, 50, 50) (xdim, ydim, zdim)のフォーマットで表される,サンプリングするデータの次元.- compute_normalsbool, default:
False 法線の計算を有効または無効にします.
- output_type
numpy.dtype, default:numpy.double 出力スカラー型を設定します.以下のいずれかを指定します.
np.float64np.float32np.int64np.uint64np.int32np.uint32np.int16np.uint16np.int8np.uint8
- cappingbool, default:
False キャッピングの有効・無効を設定します.キャッピングが有効な場合,構造化ポイントセットの外側の境界はキャップ値に設定されます.これは,サーフェスが閉じていることを確認するために使用することができます.
- cap_value
float, default:sys.float_info.max cappingパラメータで使用されるキャッピング値.- scalar_arr_name
str, default: "scalars" このデータセットのスカラー配列の名前を設定します.
- normal_arr_name
str, default: "normals" このデータセットの法線配列の名前を設定します.
- progress_barbool, default:
False 進行状況を示す進行状況バーを表示します.
- 戻り値:
pyvista.ImageDataサンプリングされたデータによる一様なグリッド.
例
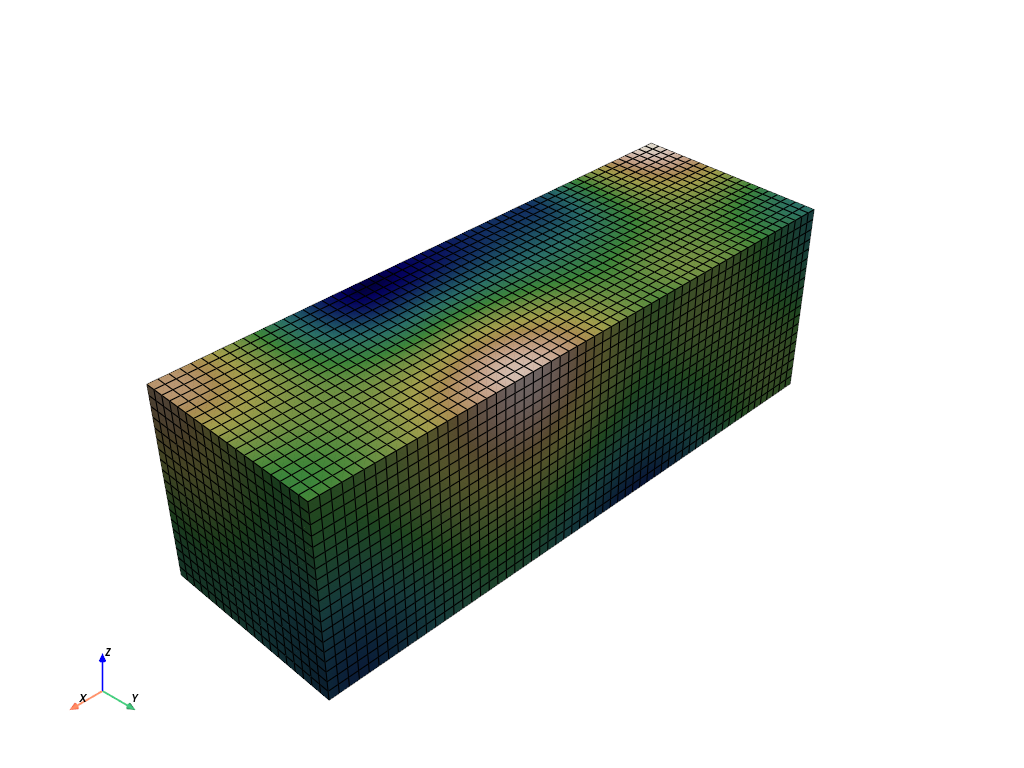
構造格子上のパーリンノイズを3Dでサンプルします.
>>> import pyvista as pv
>>> noise = pv.perlin_noise(0.1, (1, 1, 1), (0, 0, 0))
>>> grid = pv.sample_function(
...     noise, bounds=[0, 3.0, -0, 1.0, 0, 1.0], dim=(60, 20, 20)
... )
>>> grid.plot(cmap='gist_earth_r', show_scalar_bar=False, show_edges=True)
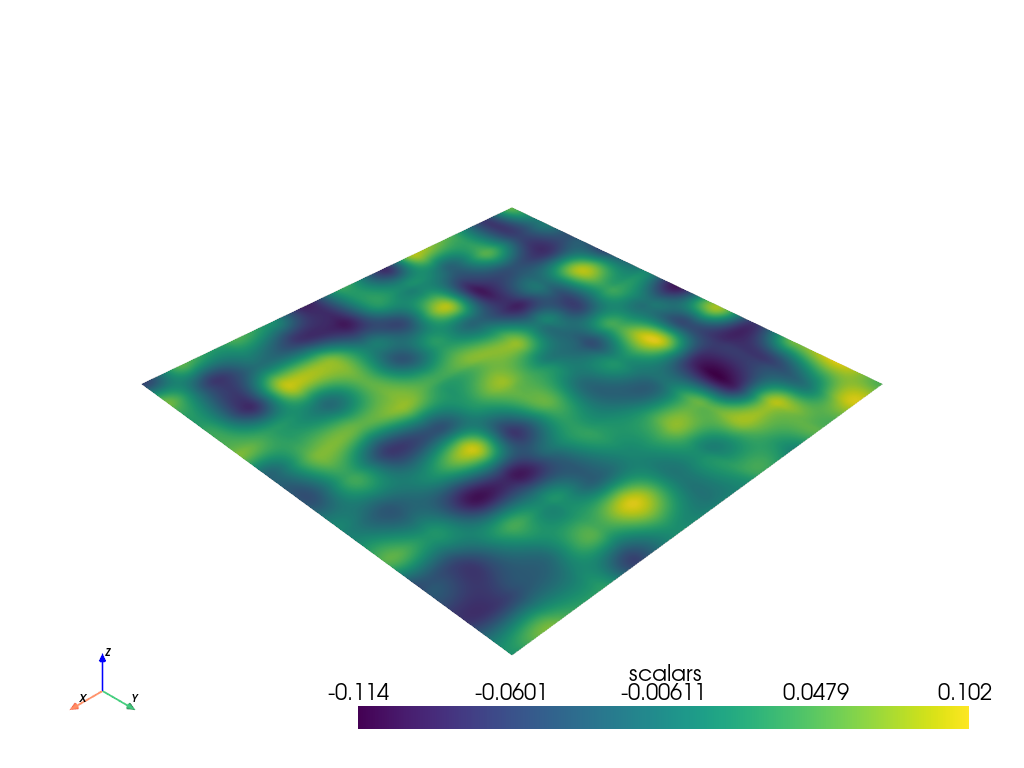
パーリンノイズを2Dでサンプリングし,プロットします.
>>> noise = pv.perlin_noise(0.1, (5, 5, 5), (0, 0, 0))
>>> surf = pv.sample_function(noise, dim=(200, 200, 1))
>>> surf.plot()
See サンプル関数:2DでのPerlinノイズ and サンプル関数:3DでのPerlinノイズ for a full example using this function.