download_coil_magnetic_field#
- download_coil_magnetic_field(load=True)[source]#
Download the magnetic field of a coil.
These examples were generated from the following script.
- Parameters:
- Returns:
- output
pyvista.ImageDataorstr DataSet or filename depending on
load.
- output
Examples
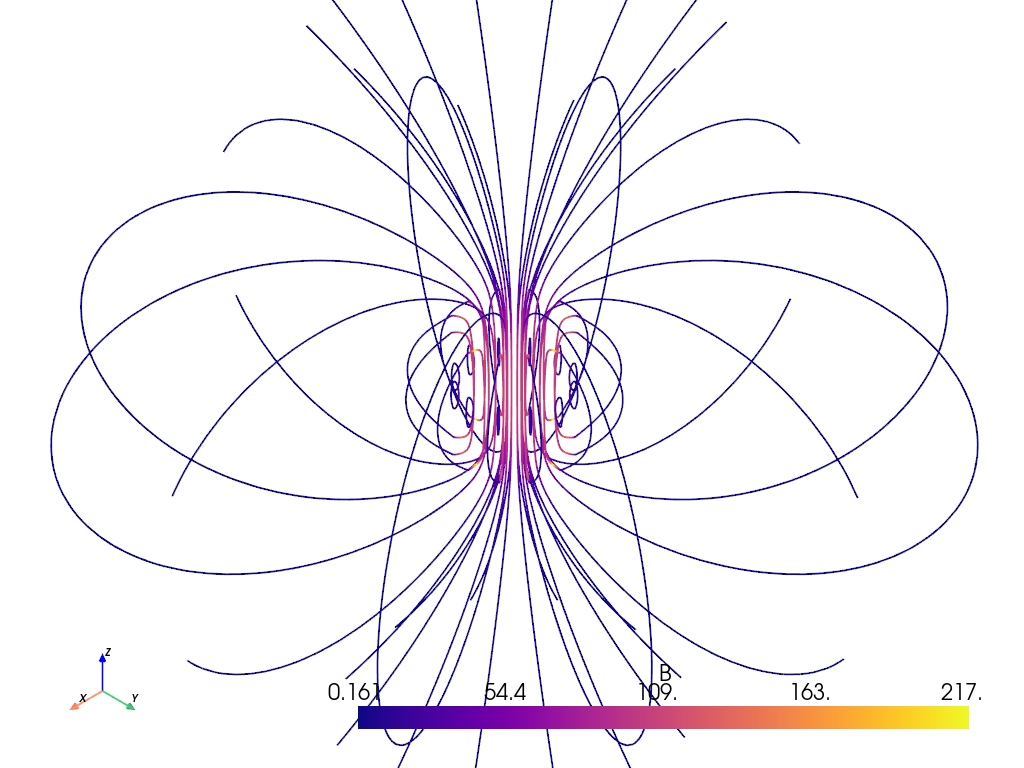
Download the magnetic field dataset and generate streamlines from the field.
>>> import pyvista as pv
>>> from pyvista import examples
>>> grid = examples.download_coil_magnetic_field()
>>> seed = pv.Disc(inner=1, outer=5.2, r_res=3, c_res=12)
>>> strl = grid.streamlines_from_source(
...     seed,
...     vectors='B',
...     max_length=180,
...     initial_step_length=0.1,
...     integration_direction='both',
... )
>>> strl.plot(
...     cmap='plasma',
...     render_lines_as_tubes=True,
...     line_width=2,
...     lighting=False,
...     zoom=2,
... )
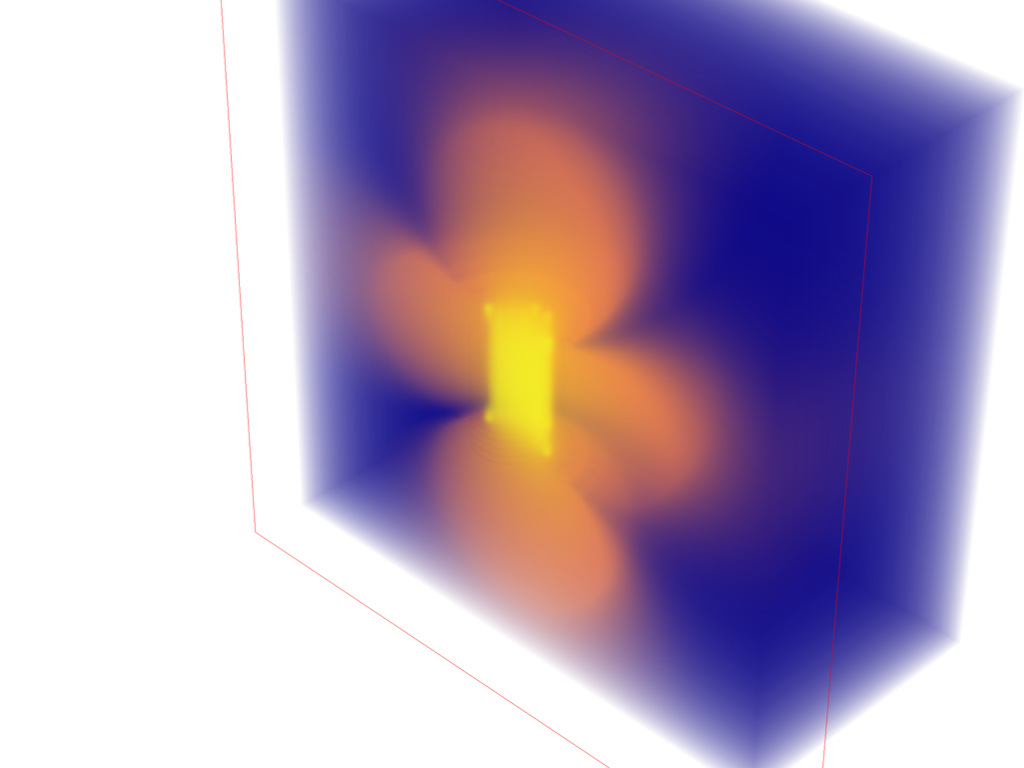
Plot the magnet field strength in the Z direction.
>>> import numpy as np
>>> import pyvista as pv
>>> from pyvista import examples
>>> grid = examples.download_coil_magnetic_field()
>>> # create coils
>>> coils = []
>>> for z in np.linspace(-8, 8, 16):
...     coils.append(
...         pv.Polygon(center=(0, 0, z), radius=5, n_sides=100, fill=False)
...     )
>>> coils = pv.MultiBlock(coils)
>>> # plot the magnet field strength in the Z direction
>>> scalars = np.abs(grid['B'][:, 2])
>>> pl = pv.Plotter()
>>> _ = pl.add_mesh(coils, render_lines_as_tubes=True, line_width=5, color='w')
>>> vol = pl.add_volume(
...     grid,
...     scalars=scalars,
...     cmap='plasma',
...     show_scalar_bar=False,
...     log_scale=True,
...     opacity='sigmoid_2',
... )
>>> vol.prop.interpolation_type = 'linear'
>>> _ = pl.add_volume_clip_plane(
...     vol,
...     normal='-x',
...     normal_rotation=False,
...     interaction_event='always',
...     widget_color=pv.Color(opacity=0.0),
... )
>>> pl.enable_anti_aliasing()
>>> pl.camera.zoom(2)
>>> pl.show()
See also
- Coil Magnetic Field Dataset
See this dataset in the Dataset Gallery for more info.
- Plot a Magnetic Field
More details on how to plot with this dataset.
