Plotter.add_ruler#
- Plotter.add_ruler(
- pointa,
- pointb,
- flip_range=False,
- number_labels=None,
- show_labels=True,
- font_size_factor=0.6,
- label_size_factor=1.0,
- label_format=None,
- title='Distance',
- number_minor_ticks=0,
- tick_length=5,
- minor_tick_length=3,
- show_ticks=True,
- tick_label_offset=2,
- label_color=None,
- tick_color=None,
- scale=1.0,
Add ruler.
The ruler is a 2D object that is not occluded by 3D objects. To avoid issues with perspective, it is recommended to use parallel projection, i.e.
Plotter.enable_parallel_projection(), and place the ruler orthogonal to the viewing direction.The title and labels are placed to the right of ruler moving from
pointatopointb. Useflip_rangeto flip the0location, if needed.Since the ruler is placed in an overlay on the viewing scene, the camera does not automatically reset to include the ruler in the view.
- Parameters:
- pointasequence[
float] Starting point for ruler.
- pointbsequence[
float] Ending point for ruler.
- flip_rangebool, default:
False If
True, the distance range goes frompointbtopointa.- number_labels
int,optional Number of labels to place on ruler. If not supplied, the number will be adjusted for “nice” values.
- show_labelsbool, default:
True Whether to show labels.
- font_size_factor
float, default: 0.6 Factor to scale font size overall.
- label_size_factor
float, default: 1.0 Factor to scale label size relative to title size.
- label_format
str,optional A printf style format for labels, e.g. ‘%E’.
- title
str, default: “Distance” The title to display.
- number_minor_ticks
int, default: 0 Number of minor ticks between major ticks.
- tick_length
int, default: 5 Length of ticks in pixels.
- minor_tick_length
int, default: 3 Length of minor ticks in pixels.
- show_ticksbool, default:
True Whether to show the ticks.
- tick_label_offset
int, default: 2 Offset between tick and label in pixels.
- label_color
ColorLike,optional Either a string, rgb list, or hex color string for label and title colors.
Warning
This is either white or black.
- tick_color
ColorLike,optional Either a string, rgb list, or hex color string for tick line colors.
- scale
float, default: 1.0 Scale factor for the ruler.
Added in version 0.44.0.
- pointasequence[
- Returns:
- vtkActor
VTK actor of the ruler.
Examples
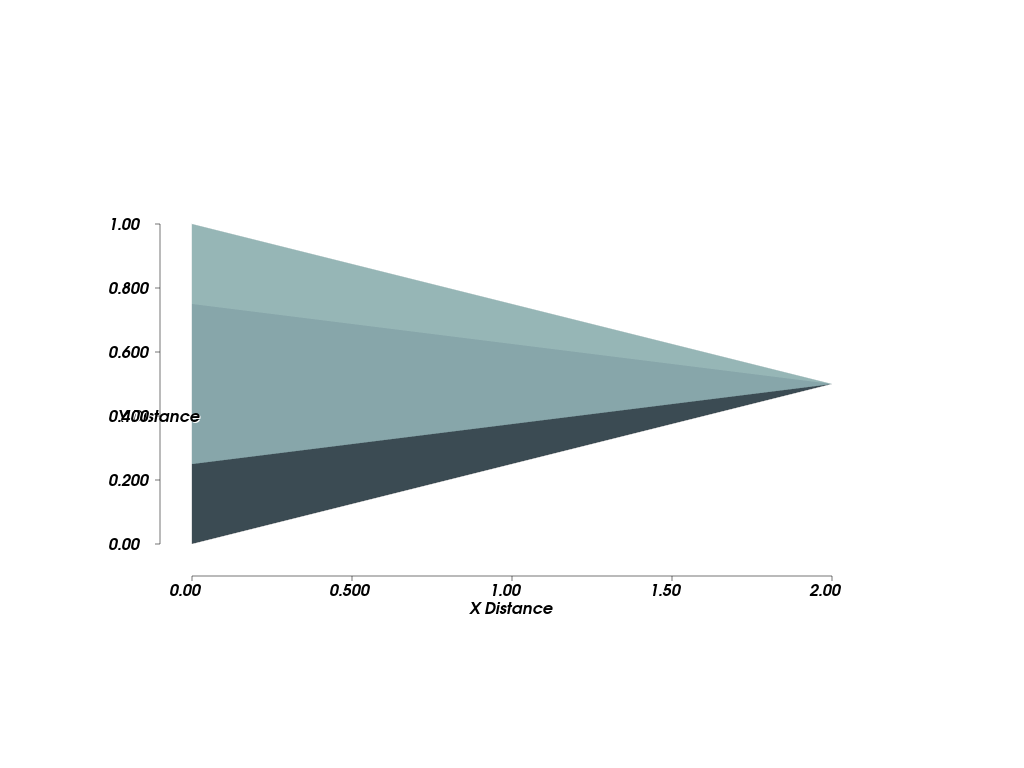
>>> import pyvista as pv
>>> cone = pv.Cone(height=2.0, radius=0.5)
>>> pl = pv.Plotter()
>>> _ = pl.add_mesh(cone)
Measure x direction of cone and place ruler slightly below.
>>> _ = pl.add_ruler(
...     pointa=[cone.bounds.x_min, cone.bounds.y_min - 0.1, 0.0],
...     pointb=[cone.bounds.x_max, cone.bounds.y_min - 0.1, 0.0],
...     title='X Distance',
... )
Measure y direction of cone and place ruler slightly to left. The title and labels are placed to the right of the ruler when traveling from
pointatopointb.>>> _ = pl.add_ruler( ... pointa=[cone.bounds.x_min - 0.1, cone.bounds.y_max, 0.0], ... pointb=[cone.bounds.x_min - 0.1, cone.bounds.y_min, 0.0], ... flip_range=True, ... title='Y Distance', ... ) >>> pl.enable_parallel_projection() >>> pl.view_xy() >>> pl.show()