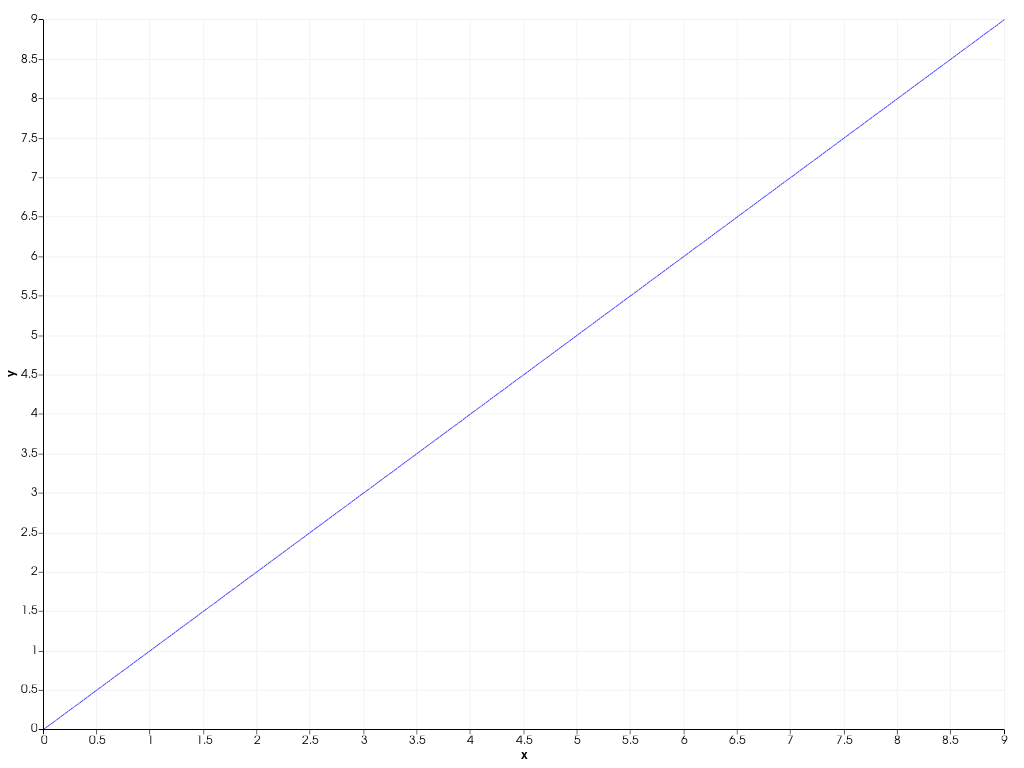
Renderer.add_chart# Renderer.add_chart(chart, *charts)[source]# Add a chart to this renderer. Parameters: chartChartChart to add to renderer. *chartsChartCharts to add to renderer. Examples >>> import pyvista as pv >>> chart = pv.Chart2D() >>> _ = chart.plot(range(10), range(10)) >>> pl = pv.Plotter() >>> pl.add_chart(chart) >>> pl.show() Static Scene Interactive Scene