Chart2D.plots#
- Chart2D.plots(plot_type=None)[source]#
Return all plots of the specified type in this chart.
- Parameters:
- plot_type
str,optional The type of plots to return. Allowed types are
"scatter","line","area","bar"and"stack". If no type is provided (None), all plots are returned, regardless of their type.
- plot_type
- Yields:
plotOne of the plots (of the specified type) in this chart.
Examples
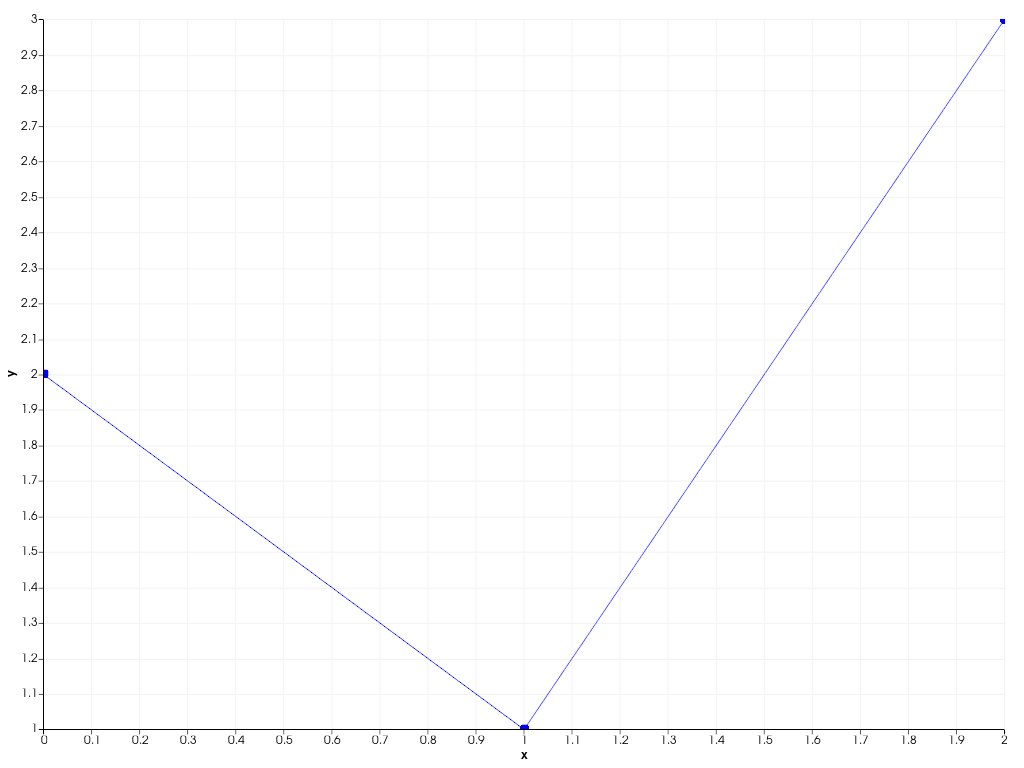
Create a 2D chart with a line and scatter plot.
>>> import pyvista as pv
>>> chart = pv.Chart2D()
>>> scatter_plot, line_plot = chart.plot([0, 1, 2], [2, 1, 3], 'o-')
>>> chart.show()
Retrieve all plots in the chart.
>>> plots = [*chart.plots()]
>>> scatter_plot in plots and line_plot in plots
True
Retrieve all line plots in the chart.
>>> line_plots = [*chart.plots('line')]
>>> line_plot == line_plots[0]
True
