Chart2D.remove_plot#
- Chart2D.remove_plot(
- plot: ScatterPlot2D | LinePlot2D | AreaPlot | BarPlot | StackPlot,
Remove the given plot from this chart.
- Parameters:
- plot
The plot to remove.
Examples
Create a 2D chart with a line and scatter plot.
>>> import pyvista as pv
>>> chart = pv.Chart2D()
>>> scatter_plot, line_plot = chart.plot([0, 1, 2], [2, 1, 3], 'o-')
>>> chart.show()

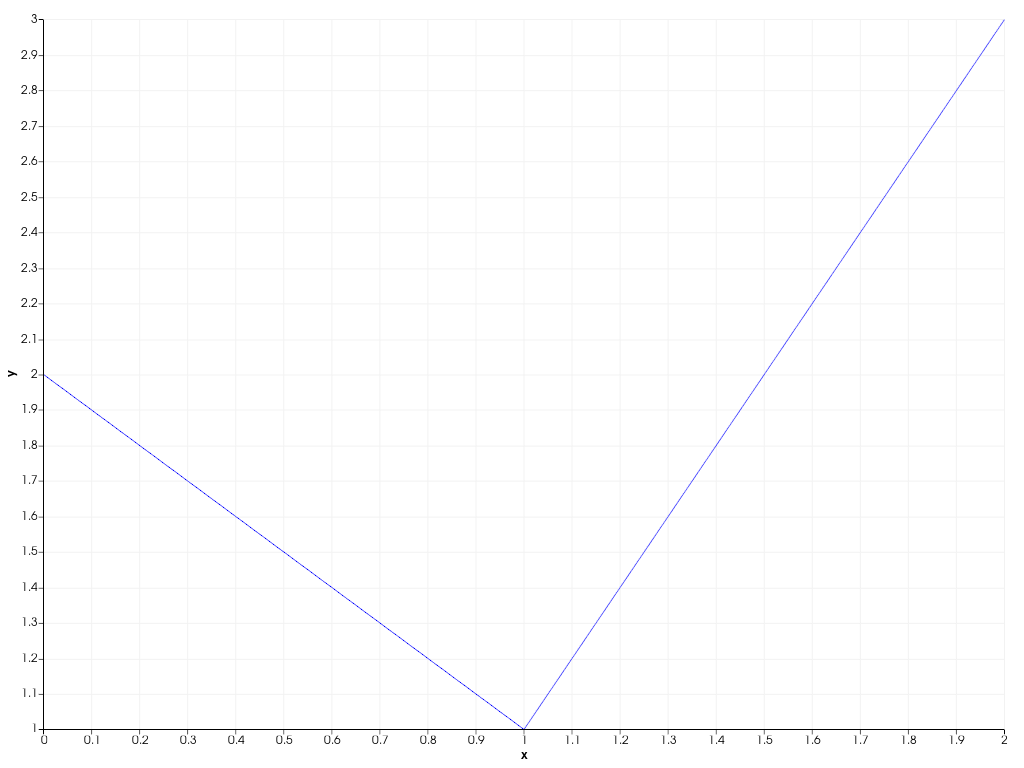
Remove the scatter plot from the chart.
>>> chart.remove_plot(scatter_plot)
>>> chart.show()