Note
Go to the end to download the full example code.
Analyze the Orientation of a Point Cloud#
Fit a line, plane, and oriented bounding box to a tilted point cloud with PyVista’s principal-axis utilities.
import numpy as np
import pyvista as pv
from pyvista import examples
Load and tilt a point cloud#
Subsample the download_horse_points()
scan and rotate the copy off the world axes so the recovered orientation
is non-trivial.
full_cloud = examples.download_horse_points()
rng = np.random.default_rng(seed=4)
sample_ids = rng.choice(full_cloud.n_points, size=3000, replace=False)
transform = pv.Transform().rotate_vector((1, 1, 0), 33).rotate_y(18)
cloud = pv.PolyData(full_cloud.points[sample_ids]).transform(transform, inplace=False)
cloud
Pick a camera that frames the rotated cloud well.
cpos = pv.CameraPosition(
    position=(0.4, -0.5, 0.25),
    focal_point=cloud.center,
    viewup=(0, 0, 1),
)
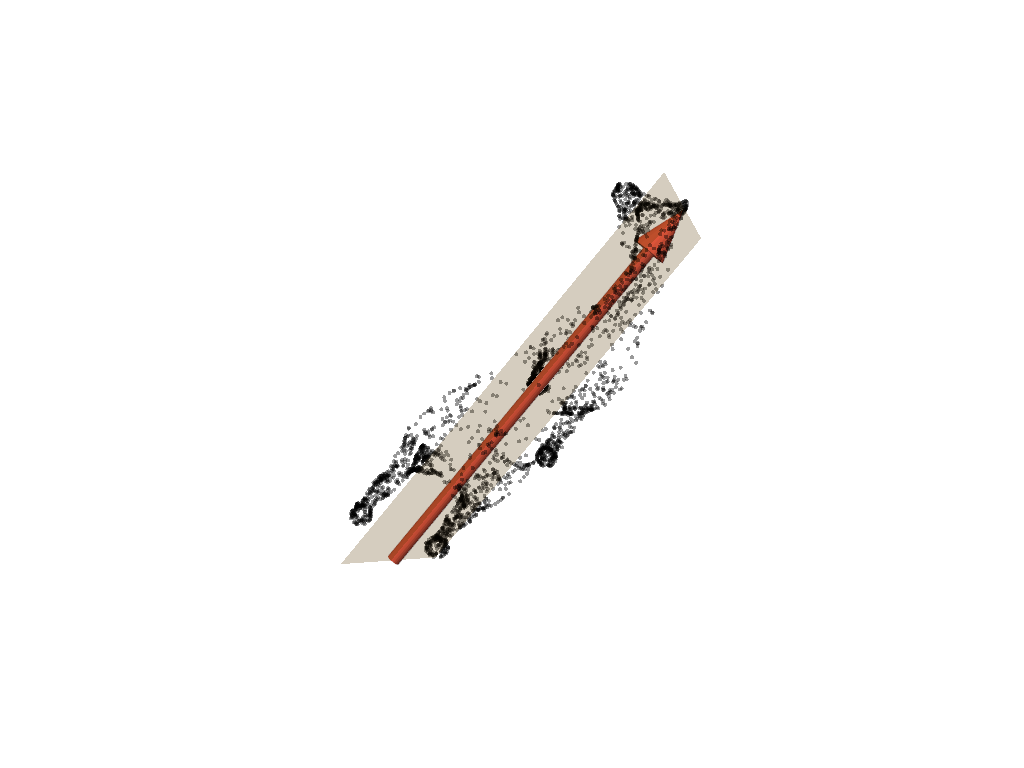
Fit a line and a plane#
The fitted line follows the cloud’s dominant axis; the fitted plane spans the two strongest principal directions.
line, length, direction = pv.fit_line_to_points(
    cloud.points,
    init_direction='x',
    return_meta=True,
)
plane = pv.fit_plane_to_points(cloud.points, init_normal='z')

arrow = pv.Arrow(
    start=line.points[0],
    direction=direction,
    scale=length,
    tip_length=0.12,
    tip_radius=0.04,
    shaft_radius=0.015,
)

pl = pv.Plotter()
pl.add_points(
    cloud,
    color='black',
    point_size=4,
    render_points_as_spheres=True,
    opacity=0.4,
)
pl.add_mesh(plane, color='orange', opacity=0.25)
pl.add_mesh(arrow, color='tomato')
pl.camera_position = cpos
pl.show()
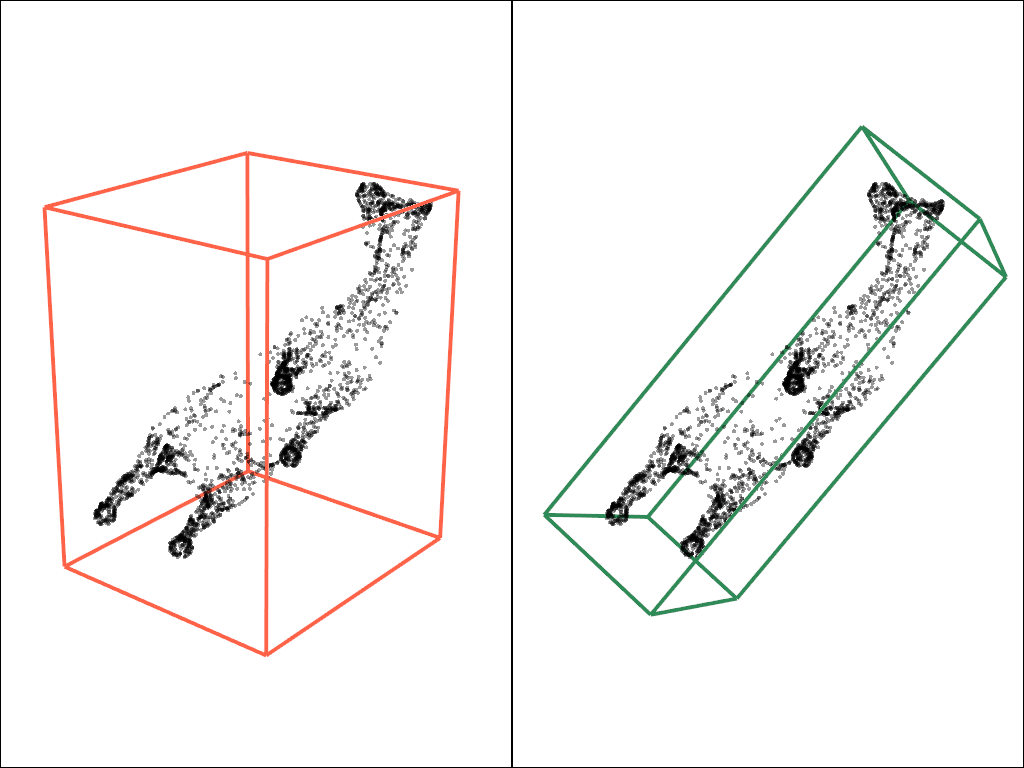
Compare axis-aligned and oriented boxes#
The axis-aligned box ignores the tilt; the oriented box snaps to the cloud’s principal directions.
axis_aligned_box = cloud.bounding_box('outline', as_composite=False)
oriented_box = cloud.oriented_bounding_box(
    'outline',
    axis_2_direction='z',
    as_composite=False,
)

pl = pv.Plotter(shape=(1, 2))
pl.subplot(0, 0)
pl.add_points(
    cloud,
    color='black',
    point_size=4,
    render_points_as_spheres=True,
    opacity=0.4,
)
pl.add_mesh(axis_aligned_box, color='tomato', line_width=4)
pl.camera_position = cpos
pl.subplot(0, 1)
pl.add_points(
    cloud,
    color='black',
    point_size=4,
    render_points_as_spheres=True,
    opacity=0.4,
)
pl.add_mesh(oriented_box, color='seagreen', line_width=4)
pl.camera_position = cpos
pl.link_views()
pl.show()
Quantify the dominant directions#
Normalized principal-axis standard deviations report the relative spread along each fitted axis.
_, std = pv.principal_axes(cloud.points, return_std=True)
std / std.sum()
array([0.56648904, 0.29031703, 0.14319395], dtype=float32)
Total running time of the script: (0 minutes 0.808 seconds)
