ImageDataFilters.label_connectivity#
- ImageDataFilters.label_connectivity(
- *,
- scalars: str | None = None,
- scalar_range: Literal['auto', 'foreground', 'vtk_default'] | VectorLike[float] = 'auto',
- extraction_mode: Literal['all', 'largest', 'seeded'] = 'all',
- point_seeds: MatrixLike[float] | VectorLike[float] | _vtk.vtkDataSet | None = None,
- label_mode: Literal['size', 'constant', 'seeds'] = 'size',
- constant_value: int | None = None,
- inplace: bool = False,
- progress_bar: bool = False,
Find and label connected regions in a
ImageData.Only points whose scalar value is within the scalar_range are considered for connectivity. A 4-connectivity is used for 2D images or a 6-connectivity for 3D images. This filter operates on point-based data. If cell-based data are provided, they are re-meshed to a point-based representation using
cells_to_points()and the output is meshed back to a cell-based representation withpoints_to_cells(), effectively filtering based on face connectivity. The connected regions are extracted and labelled according to the strategy defined byextraction_modeandlabel_mode, respectively. Unconnected regions are labelled with0value.Added in version 0.45.0.
- Parameters:
- scalars
str,optional Scalars to use to filter points. If
Noneis provided, the scalars is automatically set, if possible.- scalar_range
str,Literal[‘auto’, ‘foreground’, ‘vtk_default’],VectorLike[float] Points whose scalars value is within
'scalar_range'are considered for connectivity. The bounds are inclusive.'auto': (default) includes the full data range, similarly toconnectivity().'foreground': includes the full data range except the smallest value.'vtk_default': default to [0.5,VTK_DOUBLE_MAX].VectorLike[float]: explicitly set the range.
The bounds are always cast to floats since vtk expects doubles. The scalars data are also cast to floats to avoid unexpected behavior arising from implicit type conversion. The only exceptions is if both bounds are whole numbers, in which case the implicit conversion is safe. It will optimize resources consumption if the data are integers.
- extraction_mode
Literal[‘all’, ‘largest’, ‘seeded’], default: ‘all’ Determine how the connected regions are extracted. If
'all', all connected regions are extracted. If'largest', only the largest region is extracted. If'seeded', only the regions that include the points defined withpoint_seedsare extracted.- point_seeds
MatrixLike[float],VectorLike[float], vtkDataSet,optional The point coordinates to use as seeds, specified as a (N, 3) array like or as a vtkDataSet. Has no effect if
extraction_modeis not'seeded'.- label_mode
Literal[‘size’, ‘constant’, ‘seeds’], default: ‘size’ Determine how the extracted regions are labelled. If
'size', label regions by decreasing size (i.e., count of cells), starting at1. If'constant', label with the providedconstant_value. If'seeds', label according to the seed order, starting at1.- constant_value
int,optional The constant label value to use. Has no effect if
label_modeis not'seeds'.- inplacebool, default:
False If
True, perform an inplace labelling of the ImageData. Else, returns a new ImageData.- progress_barbool, default:
False Display a progress bar to indicate progress.
- scalars
- Returns:
pyvista.ImageDataEither the input ImageData or a generated one where connected regions are labelled with a
'RegionId'point-based or cell-based data.NDArray[int]The labels of each extracted regions.
NDArray[int]The size (i.e., number of cells) of each extracted regions.
See also
pyvista.DataSetFilters.connectivitySimilar general-purpose filter that performs 1-connectivity.
Notes
This filter implements vtkImageConnectivityFilter.
Examples
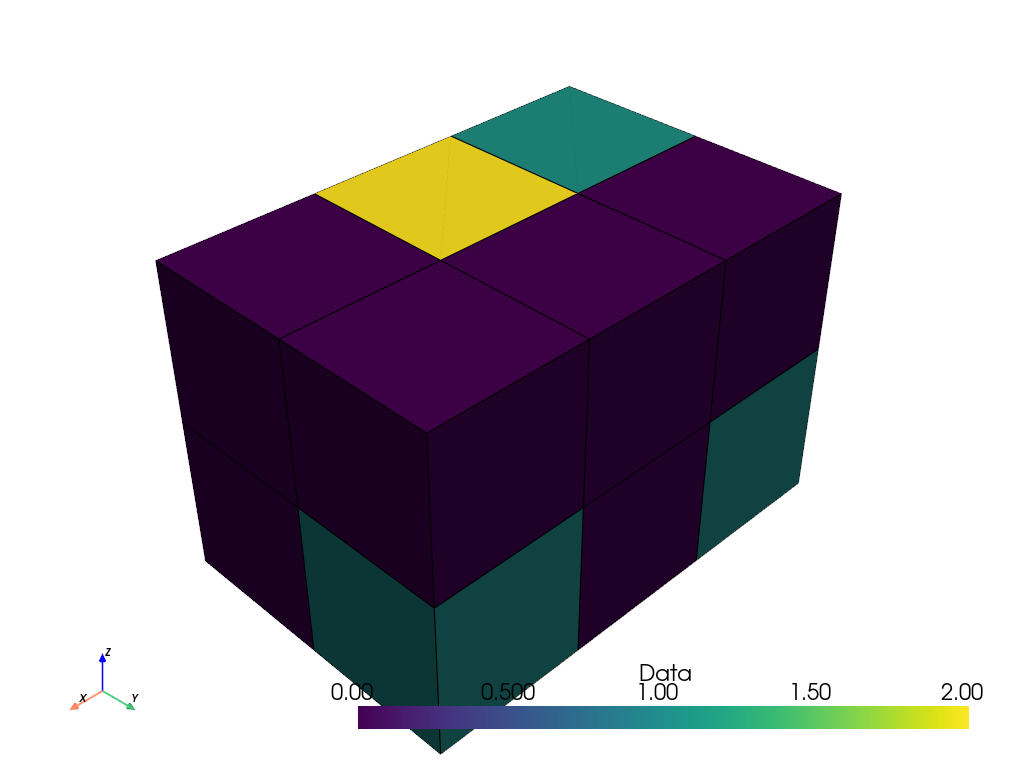
Prepare a segmented grid.
>>> import pyvista as pv
>>> segmented_grid = pv.ImageData(dimensions=(4, 3, 3))
>>> segmented_grid.cell_data['Data'] = [
...     0,
...     0,
...     0,
...     1,
...     0,
...     1,
...     1,
...     2,
...     0,
...     0,
...     0,
...     0,
... ]
>>> segmented_grid.plot(show_edges=True)
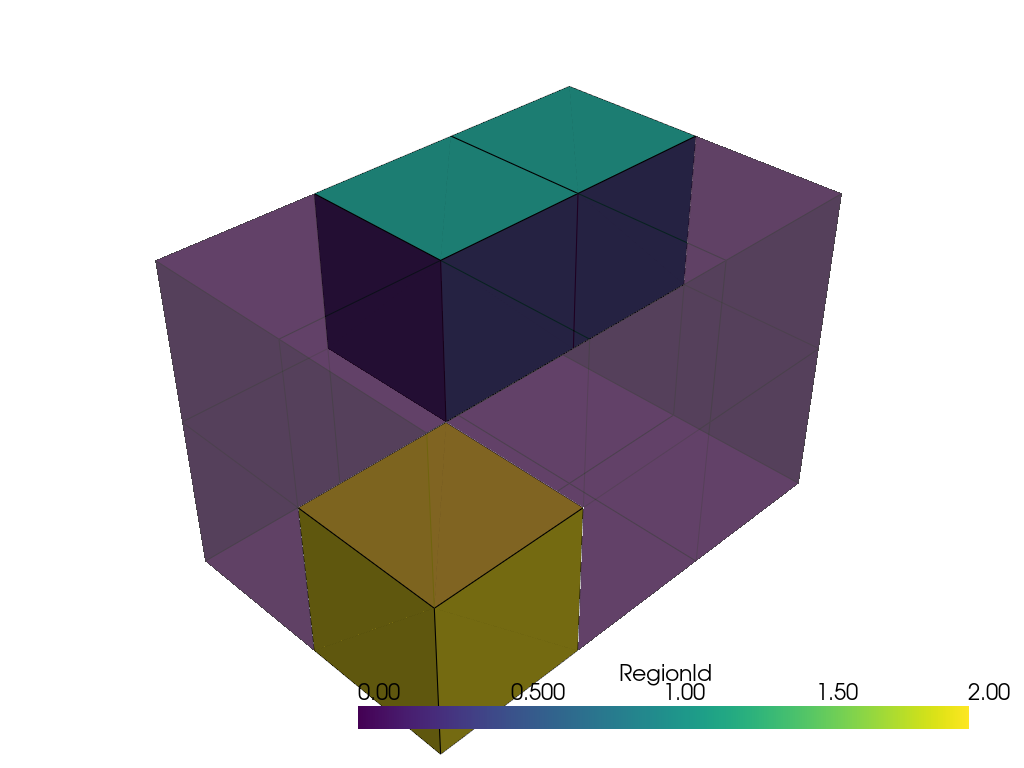
Label the connected regions. The cells with a
0value are excluded from the connected regions and labelled with0. The remaining cells define 3 different regions that are labelled by decreasing size.>>> connected, labels, sizes = segmented_grid.label_connectivity( ... scalar_range='foreground' ... ) >>> pl = pv.Plotter() >>> _ = pl.add_mesh(connected.threshold(0.5), show_edges=True) >>> _ = pl.add_mesh( ... connected.threshold(0.5, invert=True), ... show_edges=True, ... opacity=0.5, ... ) >>> pl.show()
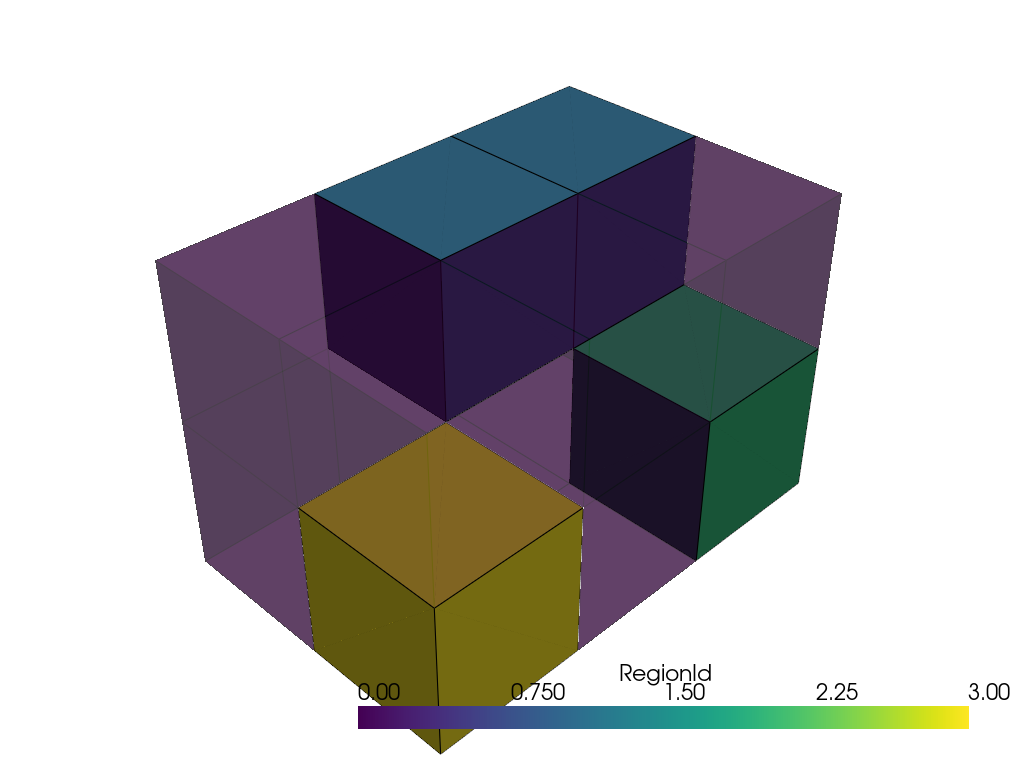
Exclude the cell with a
2value.>>> connected, labels, sizes = segmented_grid.label_connectivity( ... scalar_range=[1, 1] ... ) >>> pl = pv.Plotter() >>> _ = pl.add_mesh(connected.threshold(0.5), show_edges=True) >>> _ = pl.add_mesh( ... connected.threshold(0.5, invert=True), ... show_edges=True, ... opacity=0.5, ... ) >>> pl.show()
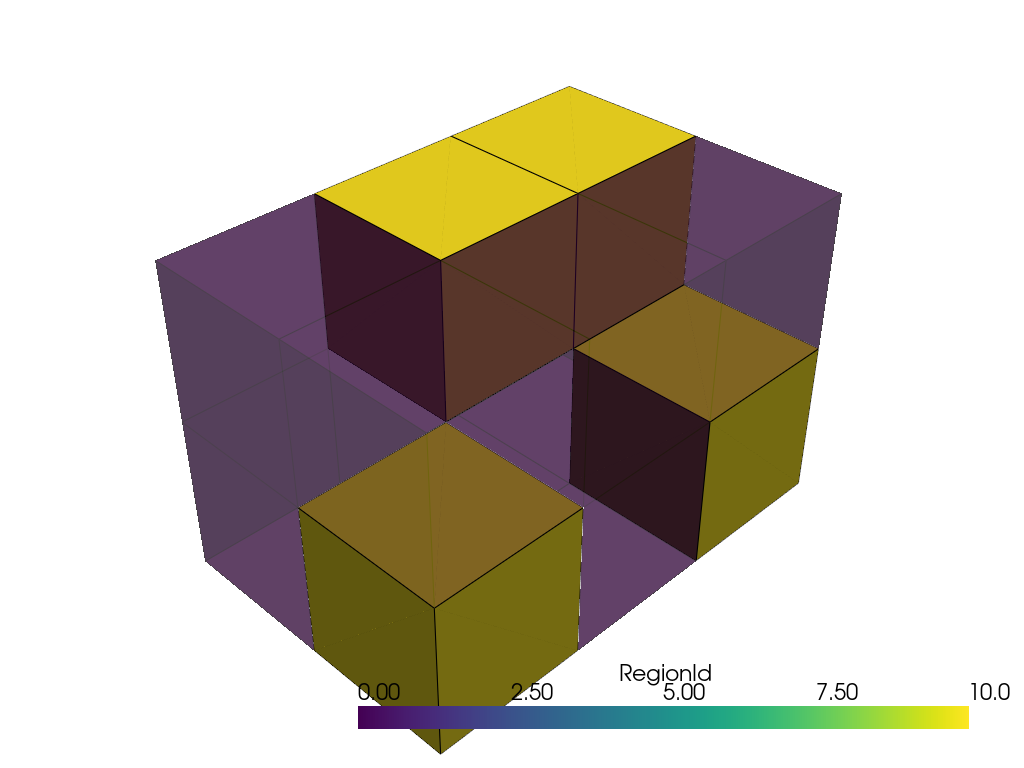
Label all connected regions with a constant value.
>>> connected, labels, sizes = segmented_grid.label_connectivity(
...     scalar_range='foreground',
...     label_mode='constant',
...     constant_value=10,
... )
>>> pl = pv.Plotter()
>>> _ = pl.add_mesh(connected.threshold(0.5), show_edges=True)
>>> _ = pl.add_mesh(
...     connected.threshold(0.5, invert=True),
...     show_edges=True,
...     opacity=0.5,
... )
>>> pl.show()
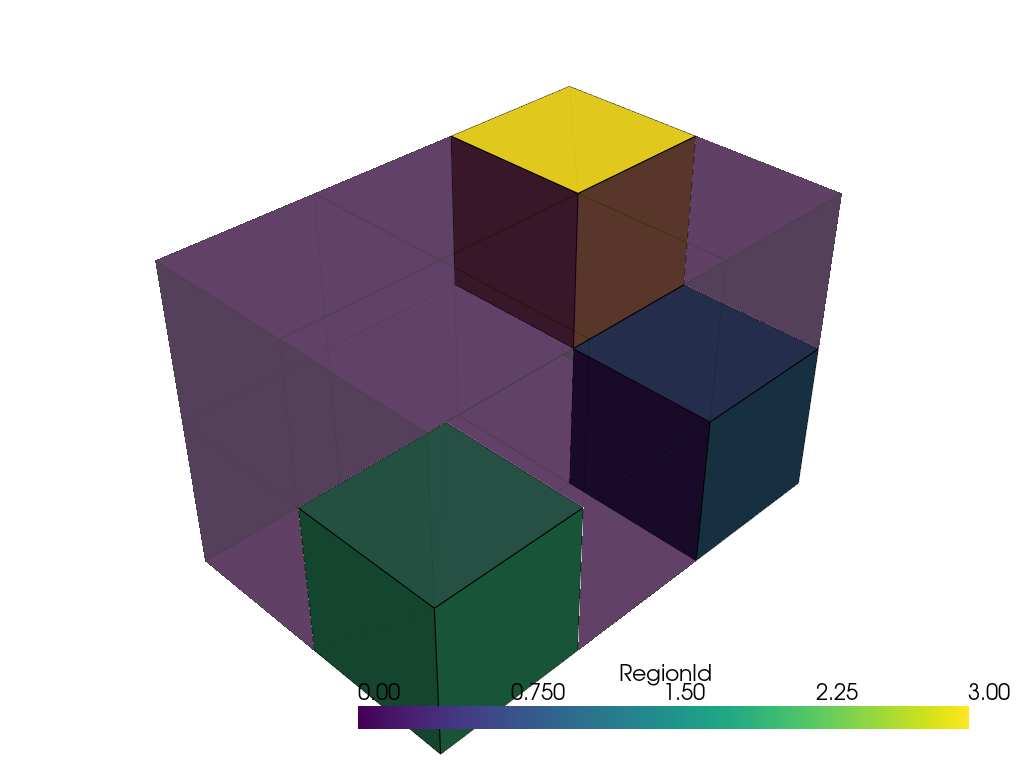
Label only the regions that include seed points, by seed order.
>>> points = [(2.0, 1.0, 0.0), (0.0, 0.0, 1.0)]
>>> connected, labels, sizes = segmented_grid.label_connectivity(
...     scalar_range='foreground',
...     extraction_mode='seeded',
...     point_seeds=points,
... )
>>> pl = pv.Plotter()
>>> _ = pl.add_mesh(connected.threshold(0.5), show_edges=True)
>>> _ = pl.add_mesh(
...     connected.threshold(0.5, invert=True),
...     show_edges=True,
...     opacity=0.5,
... )
>>> pl.show()