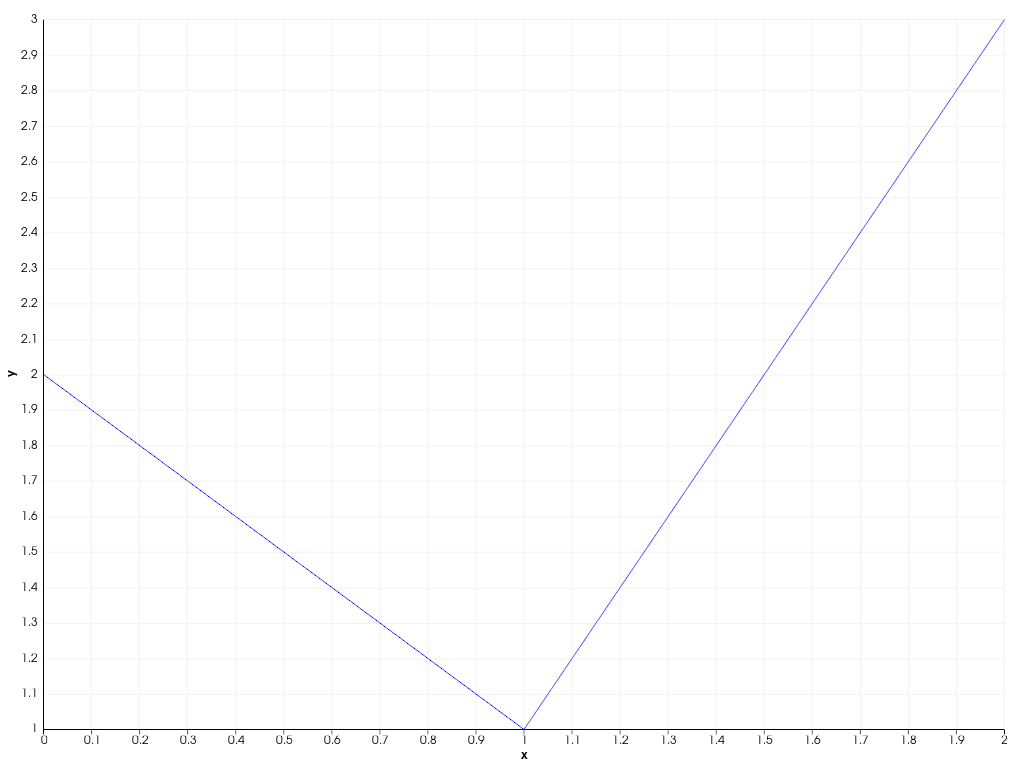
Axis.ticks_visible# property Axis.ticks_visible[source]# Return or set the tick visibility for this axis. Examples Create a 2D chart with hidden ticks on the y-axis. >>> import pyvista as pv >>> chart = pv.Chart2D() >>> _ = chart.line([0, 1, 2], [2, 1, 3]) >>> chart.y_axis.ticks_visible = False >>> chart.show()