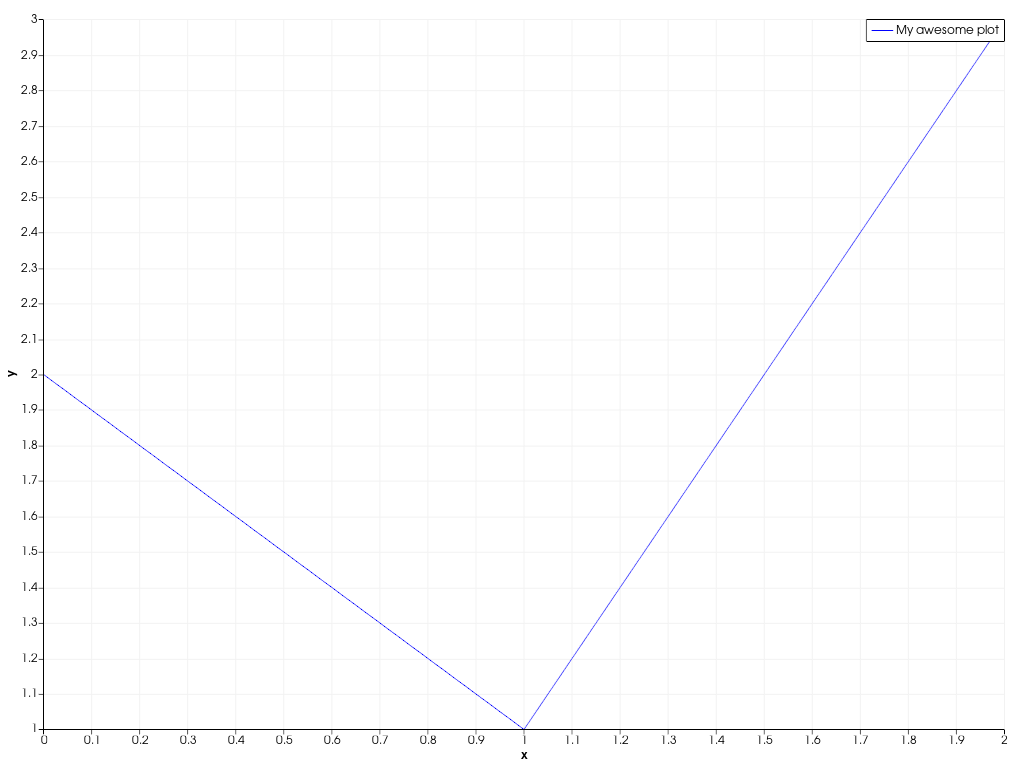
LinePlot2D.label# property LinePlot2D.label[source]# Return or set the this plot’s label, as shown in the chart’s legend. Examples Create a 2D line plot with custom label. >>> import pyvista as pv >>> chart = pv.Chart2D() >>> plot = chart.line([0, 1, 2], [2, 1, 3]) >>> plot.label = 'My awesome plot' >>> chart.show()