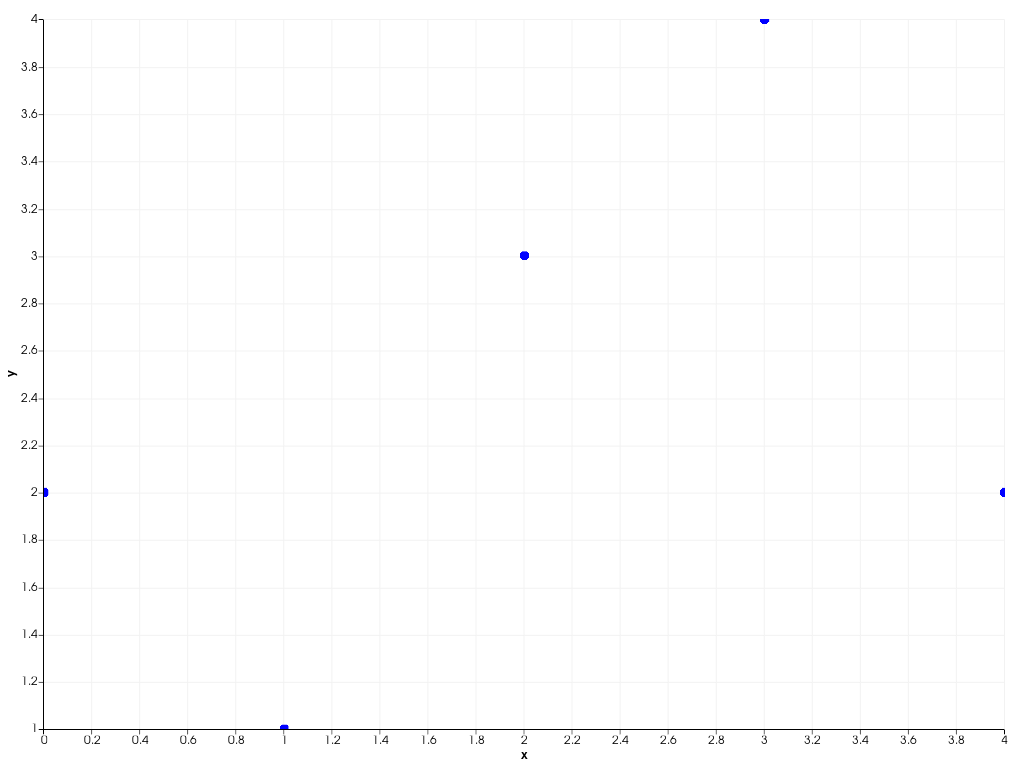
ScatterPlot2D.toggle# ScatterPlot2D.toggle() → None[source]# Toggle the plot’s visibility. Examples Create a 2D scatter plot. >>> import pyvista as pv >>> chart = pv.Chart2D() >>> plot = chart.scatter([0, 1, 2, 3, 4], [2, 1, 3, 4, 2]) >>> chart.show() Hide it. >>> plot.toggle() >>> chart.show()